Join Our Telegram channel to stay up to date on breaking news coverage
Lucky Block: August 20th
Lucky Block is progressive in finding subsequent higher support. In our last analysis for this crypto, Lucky Block was able to find significantly higher support of $0.002040. This was significantly higher than the previous one of $0.002007. In this post, Lucky Block seems to have done it again, as it appears as if it has located another higher support of $0.002070. Therefore, traders should buying into this flourishing market as soon as possible.
Current Value of LBLOCK’S: $0.002070
LBLOCK Market Cap: $7.4 million
LBLOCKs Circulating Supply: ——
LBLOCKs Total Supply: 3.6 billion
LBLOCKs Coinmarketcap Ranking: #3391
Important Value Marks:
Top Levels: $0.002070, $0.002100, $0.002350
Bottom Levels: $0.002170, $0.002100, $0.002053
LBLOCK Price Analysis: LBLOCK/USD Market Is Pumping
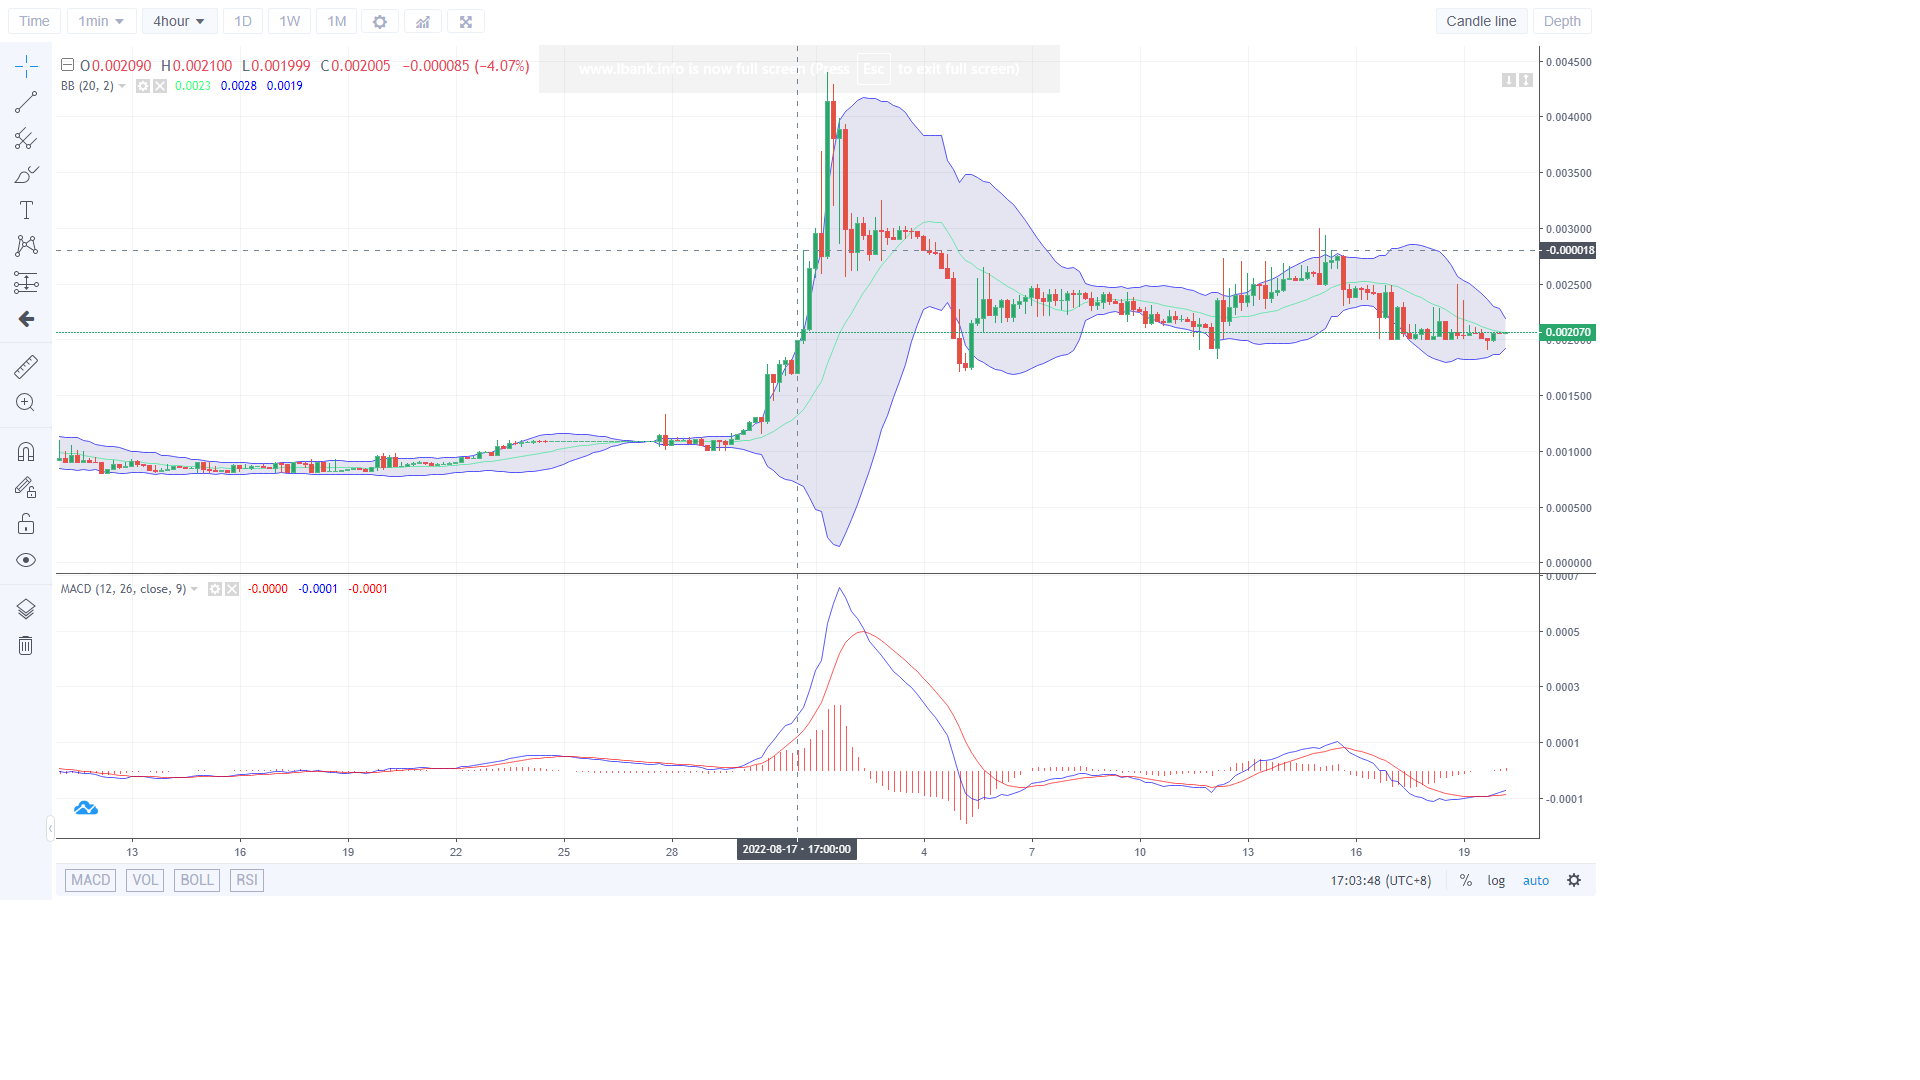
The LBLOCK/USD four-hour chart above is showing that the price of this crypto is advancing. On this chart, we can view that the price candles are already in contact with the Moving Average line of the Bollinger indicator. If eventually, price action should rise above this line, Lucky Block might claim a new higher support level. In addition, we can see that our Bollinger indicator upper and lower band is now contracting at this point. Consequently, this may be hinting that a significant price increase is near. Eventually, this may bring the price to around $0.002500 price level.
Lucky Blocks Value Forecast: LBLOCK/USD Price Continues to Break Upwards
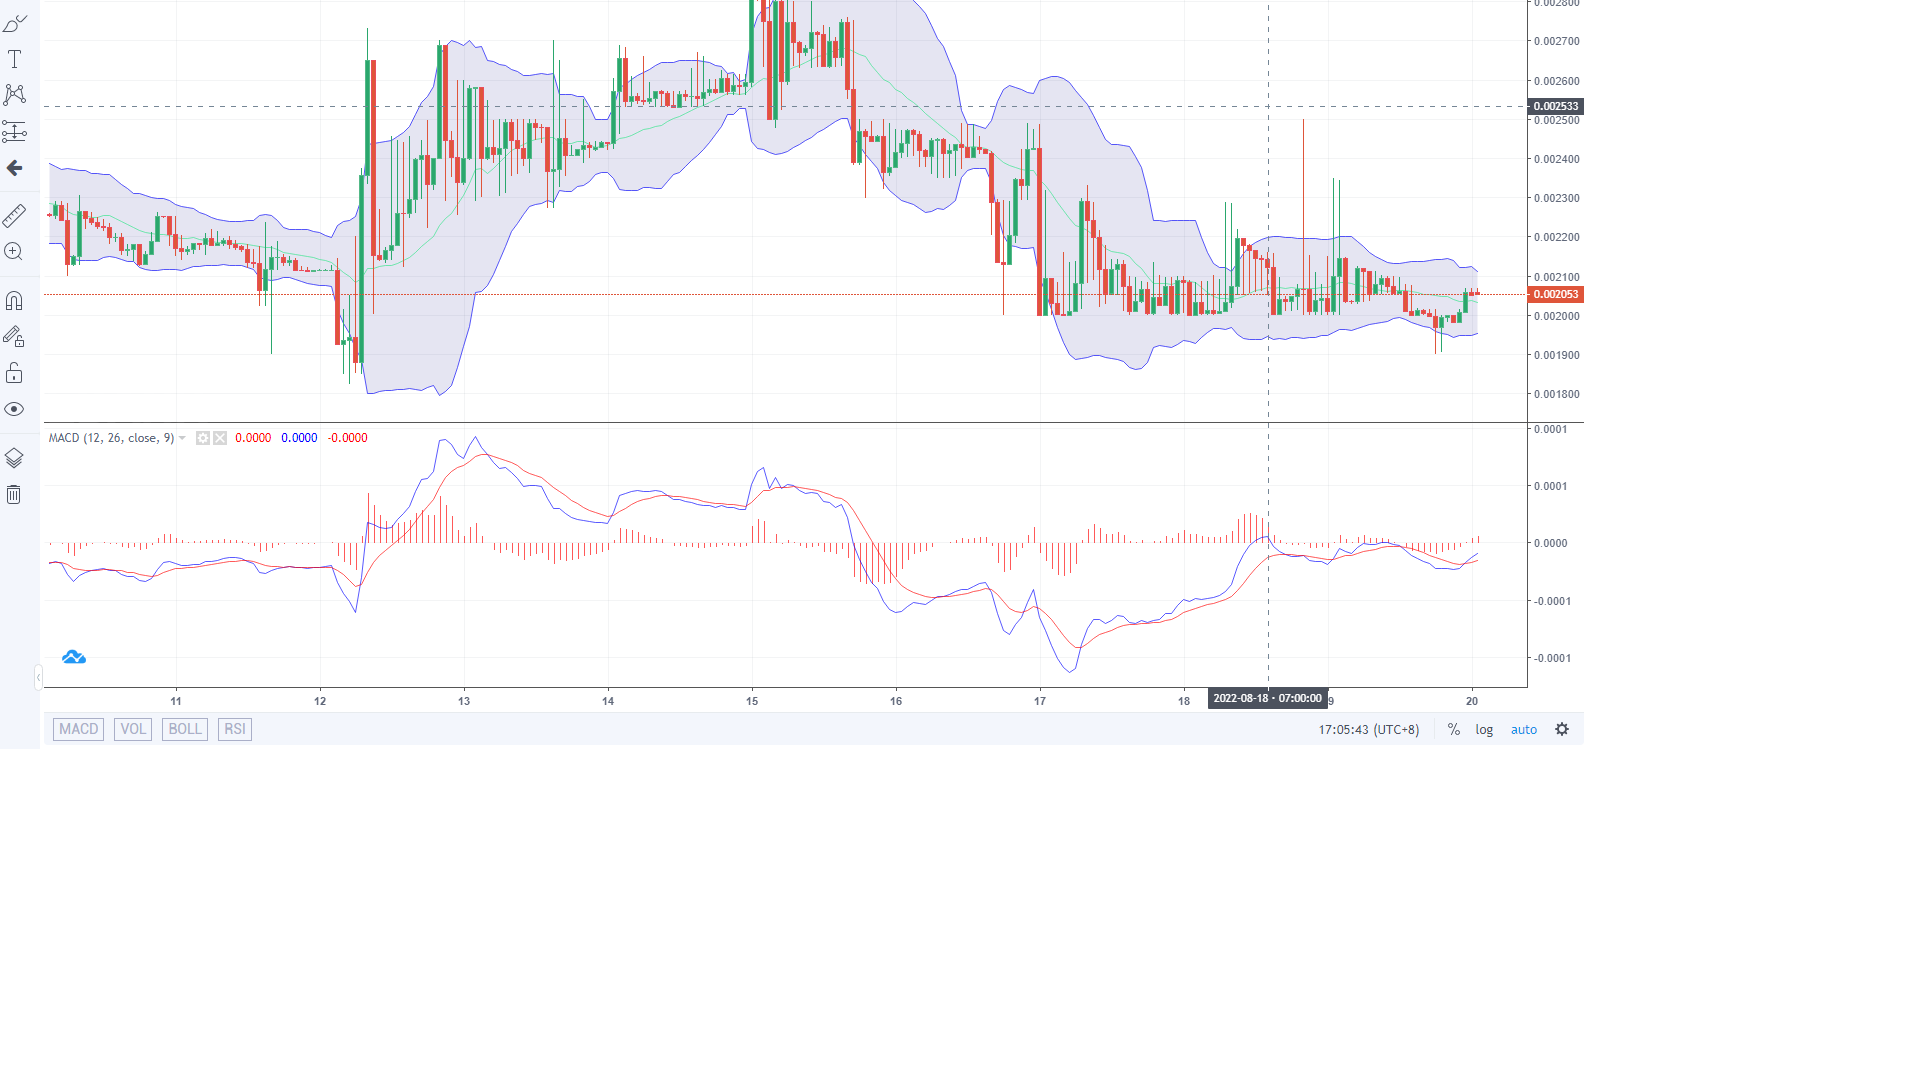
On this hourly LBLOCK/USD chart Indicators are pointing to more upside gain. Here, we can see that a large bullish candle eventually delivered price action above the middle MA line. Also, the last two candles here are constantly changing from red to green on a live market, due to the struggle between buyers and sellers. And, the nature of this candle when it is green, points to an impending bullish reversal, eventually this will take price higher.
Additionally, we can see that the MACD lines are attempting to cross to the positive side. Also, we can see that the discrete line which represents bar charts is now building on the positive side. Consequently, this is pointing to increasing strength of the current uptrend. Soon enough, the price level of $0.002100 will be broken and more upside level will be reached shortly.
Lucky Block (LBLOCK V2): Gate.io listing has been set to be done on 25th August.
You can purchase Lucky Block here. Buy LBLOCK
Related
Join Our Telegram channel to stay up to date on breaking news coverage