Join Our Telegram channel to stay up to date on breaking news coverage
ETH Price Prediction – May 13
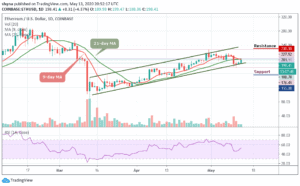
The Ethereum price is trying to keep its upward movement as the sellers kept on frustrating the movement.
ETH/USD Market
Key Levels:
Resistance levels: $230, $235, $240
Support levels: $155, $150 $145
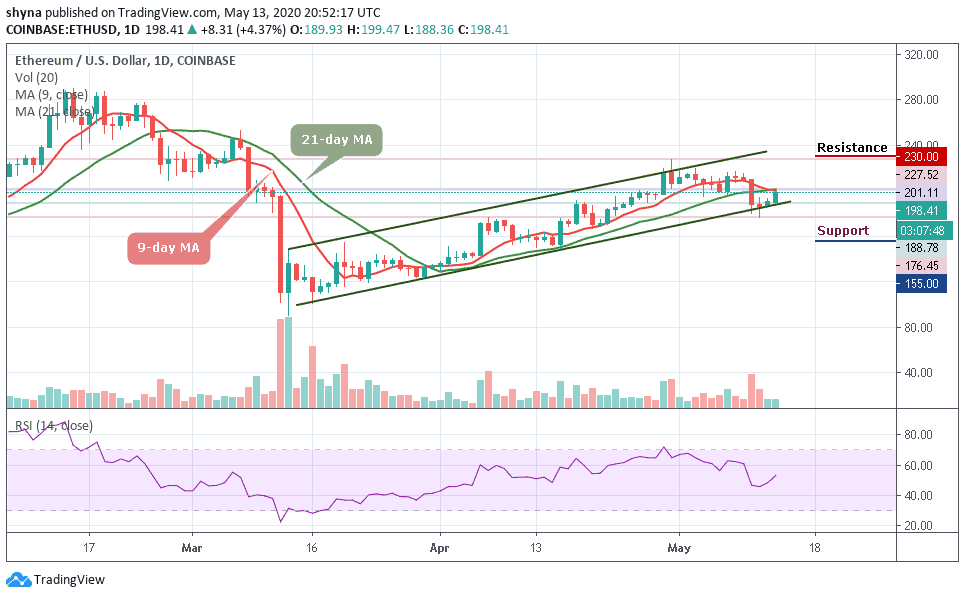
ETH/USD is currently showing some signs of improvement as the price moves above $198 from where it started trading at $188.78. The cryptocurrency broke in the last 2days following a bullish continuation pattern to cross above the 9-day and 21-day moving averages and holders must therefore closely monitor this coin.
On the upside, once the price of Ethereum crosses its nearest resistance at $200, it will manage to trade above $220 price mark in the upcoming days. However, on the downside, a support point at $170 will be there to minimize the risk of a crash. Meanwhile, the technical indicator RSI (14) of ETH now figures near 55-level, having an inclination towards the bullish move.
However, the on-going trend may move a little bit higher before this week runs out, and the coin may likely cross the moving averages to touch the potential resistance at $230, but if the bulls put more effort, it could hit additional resistance levels at $235, and $240 respectively. More so, any bearish movement below the lower boundary of the channel could reach the support levels of $155, $150, and $145.
Against Bitcoin, Ethereum is following a bearish sentiment and about to break down the channel. The coin is suffering from a strong buying power as the bulls are trying to gain momentum; the sellers continue to release huge pressure on the market. For now, Ethereum is trading around 0.0211 BTC which is very close to its all-time low.
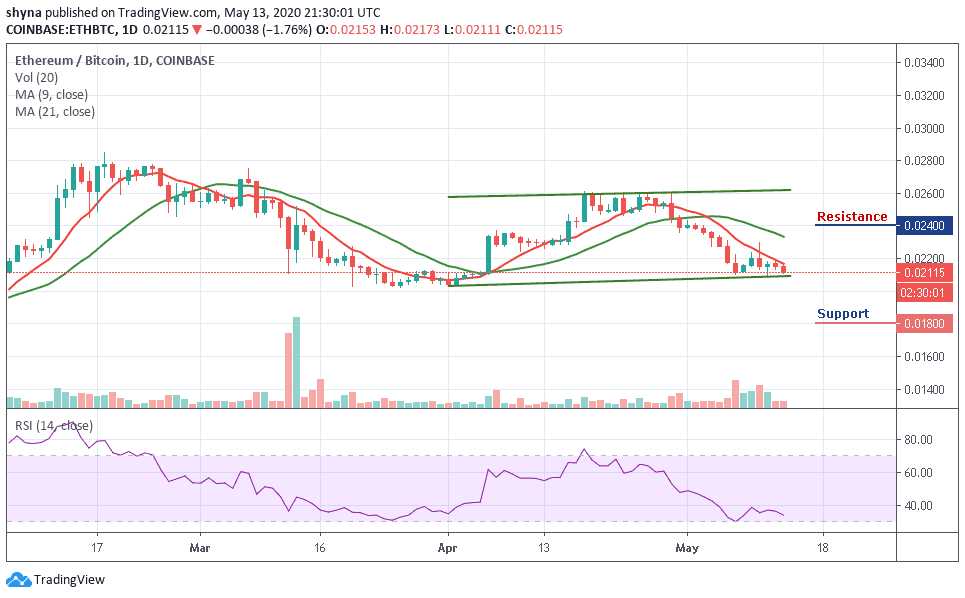
Furthermore, the bearish scenario might rally further to 0.018 BTC and 0.017 BTC support levels. Currently, the RSI (14) indicator is moving towards the oversold zone, and should the bulls manage to find support at this level, an upward movement could push the price to the 0.024 BTC and potentially 0.025 BTC resistance levels. But, a glance at the current market suggests a dominant downtrend for ETH/BTC market.
Please note: Insidebitcoins.com is not a financial advisor. Do your research before investing your funds in any financial asset or presented product or event. We are not responsible for your investing results.
Join Our Telegram channel to stay up to date on breaking news coverage