Join Our Telegram channel to stay up to date on breaking news coverage
Bitcoin (BTC) Price Prediction – September 30
At the time of writing, the Bitcoin price is trading in a crucial range between $10,500 and $11,000.
BTC/USD Long-term Trend: Ranging (Daily Chart)
Key levels:
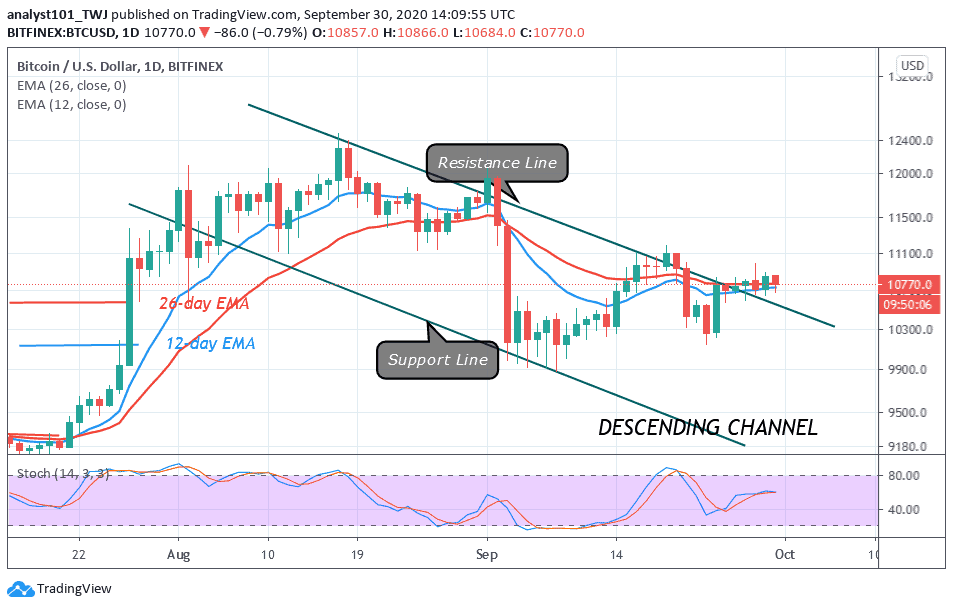
Resistance Levels: $11,500, $11,700, $11,900
Support Levels: $10,200, $10,000, $9,800
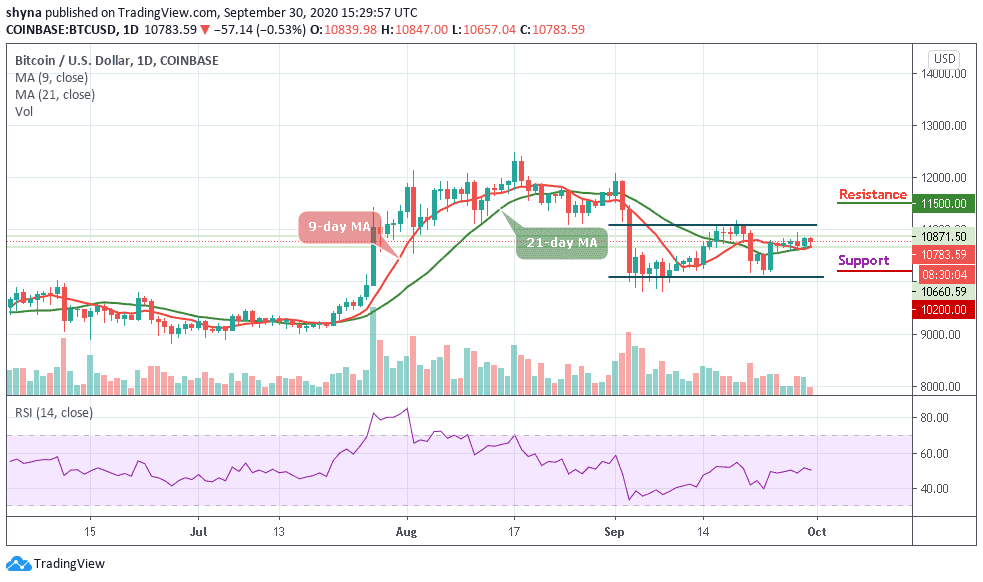
BTC/USD is still struggling to clear the $10,950 and $11,000 resistance levels as the coin moves above the 9-day and 21-day moving averages. However, it seems like the Bitcoin price is stuck in a crucial range above the $10,500 support. The price is currently well above the $10,700 and it might make another attempt to surpass $11,000 in the coming sessions.
Where is BTC Price Going Next?
If BTC/USD delays the run-up to the resistance level of $11,000, sellers could eventually gain traction to send the price back to $10,600 support. Any further bearish movement can be located at $10,200, $10,000, and $9,800 supports. From there, the bulls could have gathered the energy to push towards the $11,000, mainly riding on newly created support from investors who choose to buy low. Traders should note that if the support at $10,600 is shattered, BTC/USD may be forced to seek refuge in the next key range at $10,500 – $10,300.
Moreover, BTC/USD could invalidate the reversal to $10,600 if the price holds above the moving averages. On the upside, a break above $11,000 would pave the way for gains towards $11,200 resistance, in turn, allowing buyers to shift the focus back to the resistance levels of $11,500, $11,700, and $11,900 respectively. Unfortunately, the bullish case has been cut short as the technical indicator moves below 50-level.
BTC/USD Medium-Term Trend: Ranging (4H Chart)
According to the 4-hour chart, BTC/USD is trading within the range of $10,600 to $10,900. However, intraday trading is looking bearish at the beginning of today’s trading at $10,847, which is now a key resistance level. Meanwhile, the next key resistance levels are located at $10,900 and above.
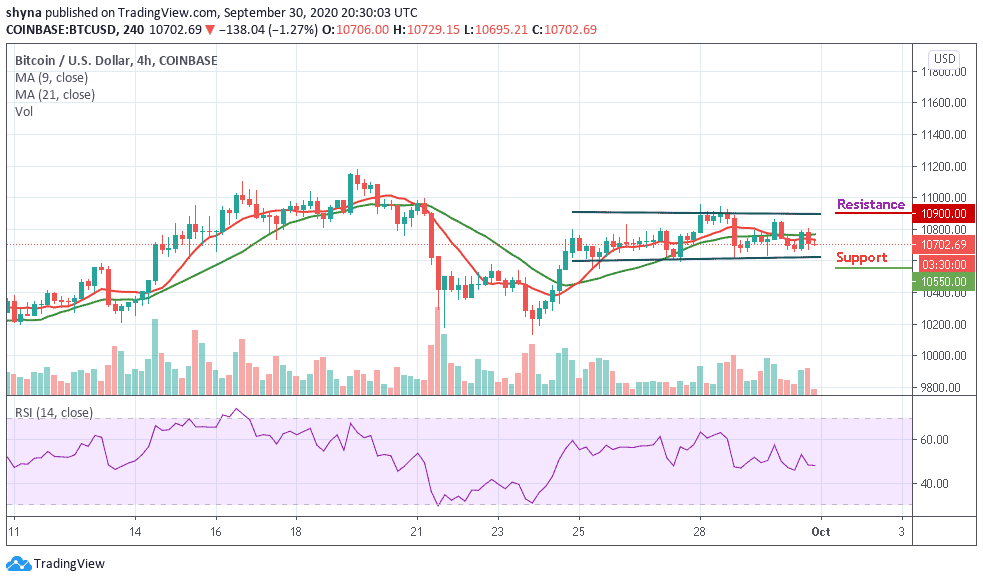
However, in as much as the sellers continue to reinforce and power the market more, traders can expect a retest at the $10,600 support level, and breaking this level may further drag the price towards the support level of $10,550 and below. Similarly, the RSI (14) moves below 50-level to confirm the bearish movement.
Join Our Telegram channel to stay up to date on breaking news coverage