Join Our Telegram channel to stay up to date on breaking news coverage
Bitcoin (BTC) Price Prediction – December 20
The Bitcoin price shot above $24,250 for the first time this year as bulls retain the uptrend.
BTC/USD Long-term Trend: Bullish (Daily Chart)
Key levels:
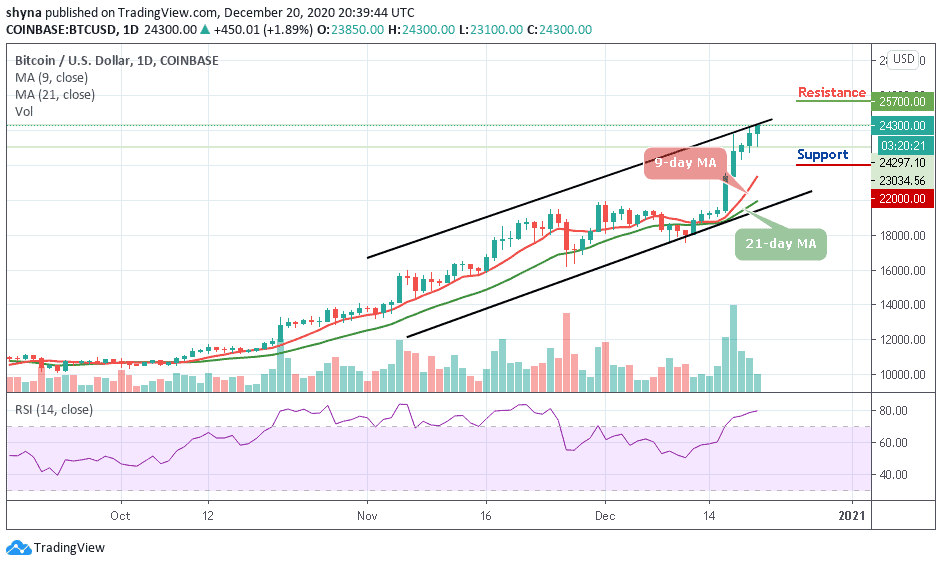
Resistance Levels: $25,700, $25,900, $26,100
Support Levels: $22,000, $21,800, $21,600
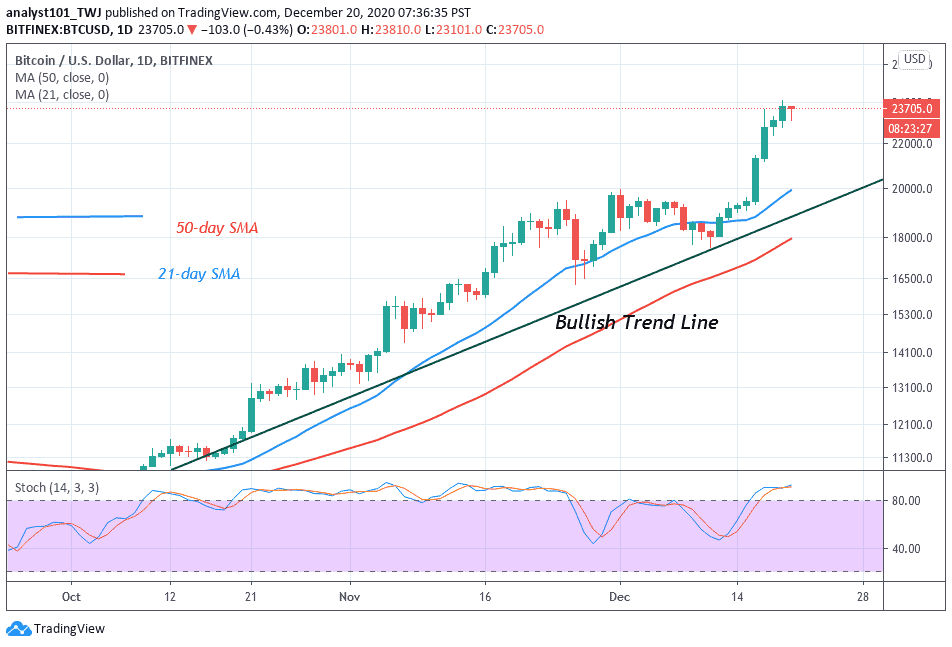
BTC/USD jumps above $24,000 in the cause of today’s trading. However, the coin had been moving tremendously since the last two weeks, with the technical indicator RSI (14) swimming in the overbought zone. Yesterday’s breakout above $24,000 paved the way for a flash rally to $24,200 which happens to be yesterday’s high. Meanwhile, in the next negative moves, BTC/USD may be retreating towards the south but may defend the ground above $23,000.
What Could Be the Next Direction of BTC?
Looking at the daily chart, BTC/USD is likely to change towards the downtrend targeting $22,500 in the short term. To avert the losses buyers have a task to keep the price above $24,200 and even pull above $24,500. A step past $25,000 would encourage more buyers to join the market for another run towards $25,500.
However, any failure by the bulls to move the price up may result in a price cut to $22,500 vital support. A further low drive could send the price to $22,000, $21,800, and $21,600 supports. Currently, Bitcoin bulls are still dominating the market. But as things stand, the BTC/USD price may continue to follow the upward trend while the nearest resistance lies at $25,700, $25,900, and $26,100 levels.
BTC/USD Medium – Term Trend: Ranging (4H Chart)
Looking at the 4-hour chart, Bitcoin’s price is currently trading around $23,524 and crossing below the 9-day and 21-day moving averages after touching the low of $23,111 today. From a technical point of view, the trend is consolidating to the upside.
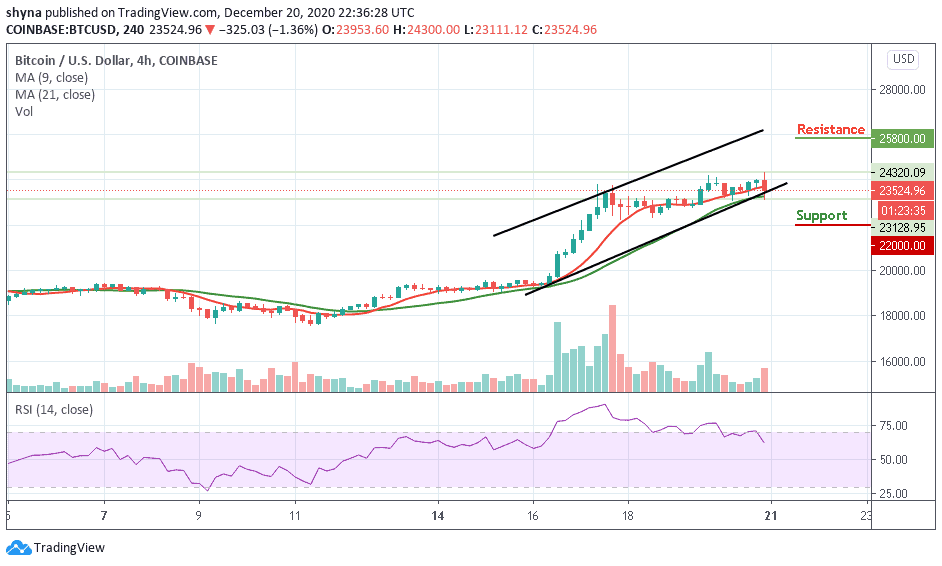
The technical indicator RSI (14) is retreating from the oversold, even though it had not reached the 60-level. As long as the downward trend continues, keeping Bitcoin above $24,000 may be a daunting task. In this case, it is best we look at possible support levels, starting at $22,000, $21,800, and $21,600. While the resistance lies at $25,800 and above.
Join Our Telegram channel to stay up to date on breaking news coverage