Join Our Telegram channel to stay up to date on breaking news coverage
Key Points
- Bitcoin price is still struggling to clear the key $6,520 resistance zone against the US Dollar.
- There is an important bullish trend line in place with support at $6,430 on the hourly chart of the BTC/USD pair (data feed from Kraken).
- The price is currently at a risk of a bearish reaction towards the $6,400 or $6,340 support levels.
Bitcoin price is slowly moving into a bearish zone below $6,480 against the US Dollar. BTC/USD could extend the current dip towards $6,340 if buyers lose control.
Bitcoin Price Analysis
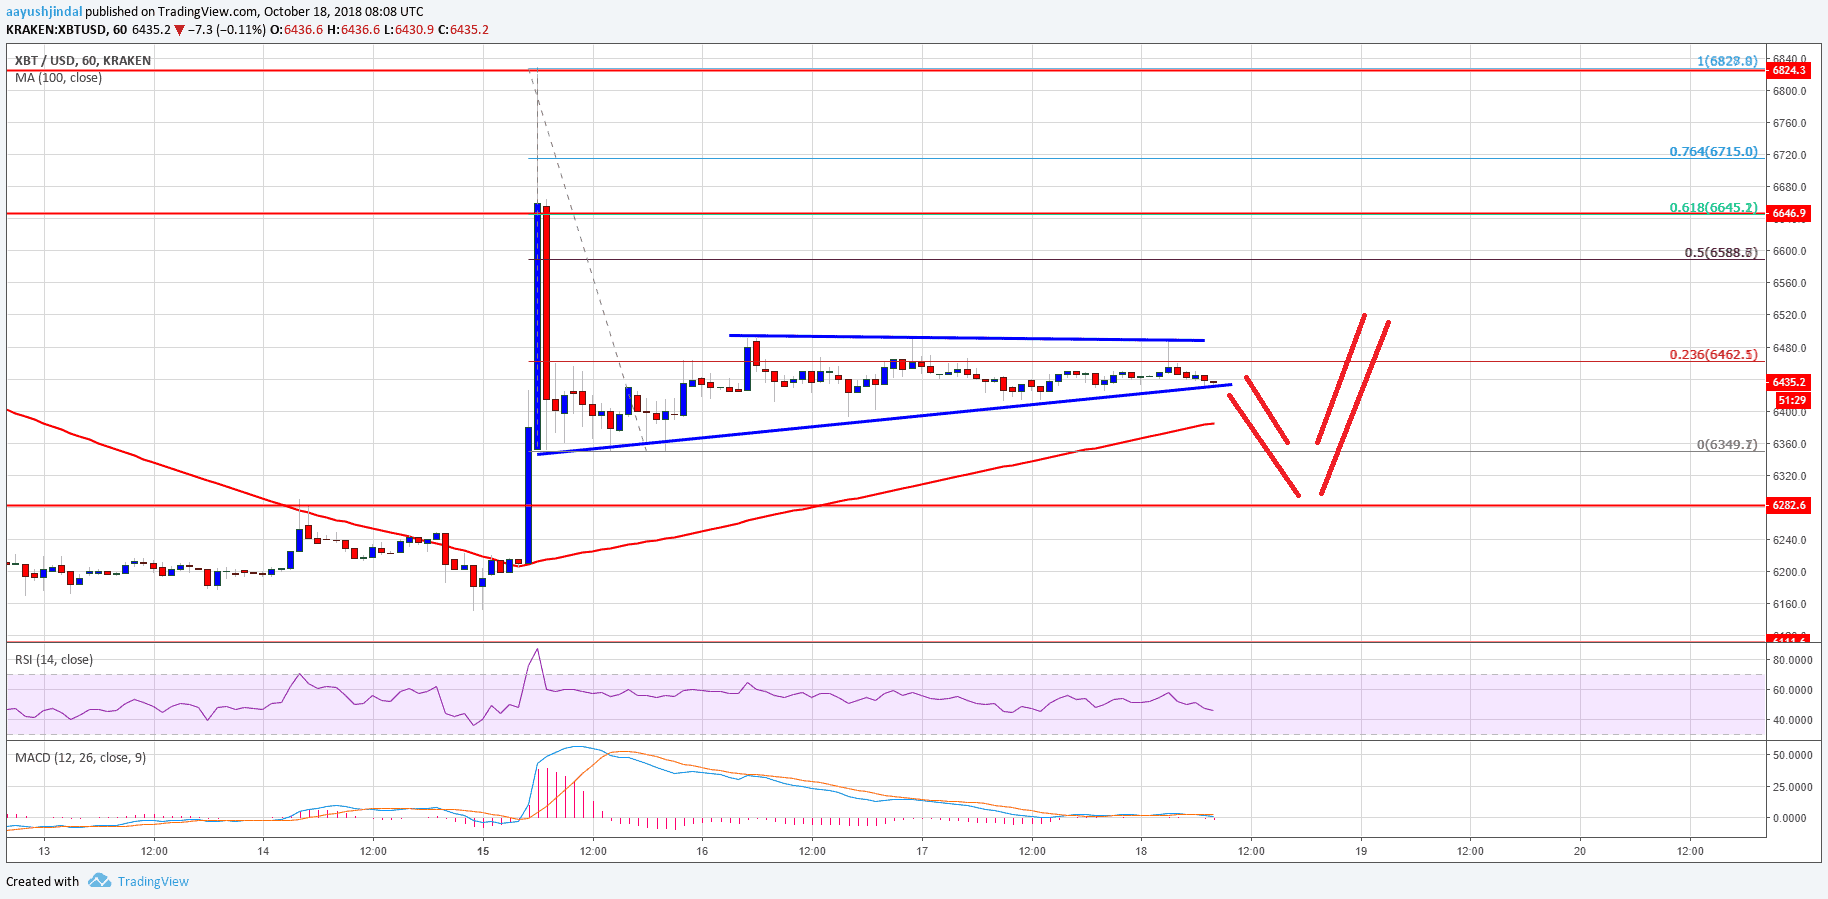
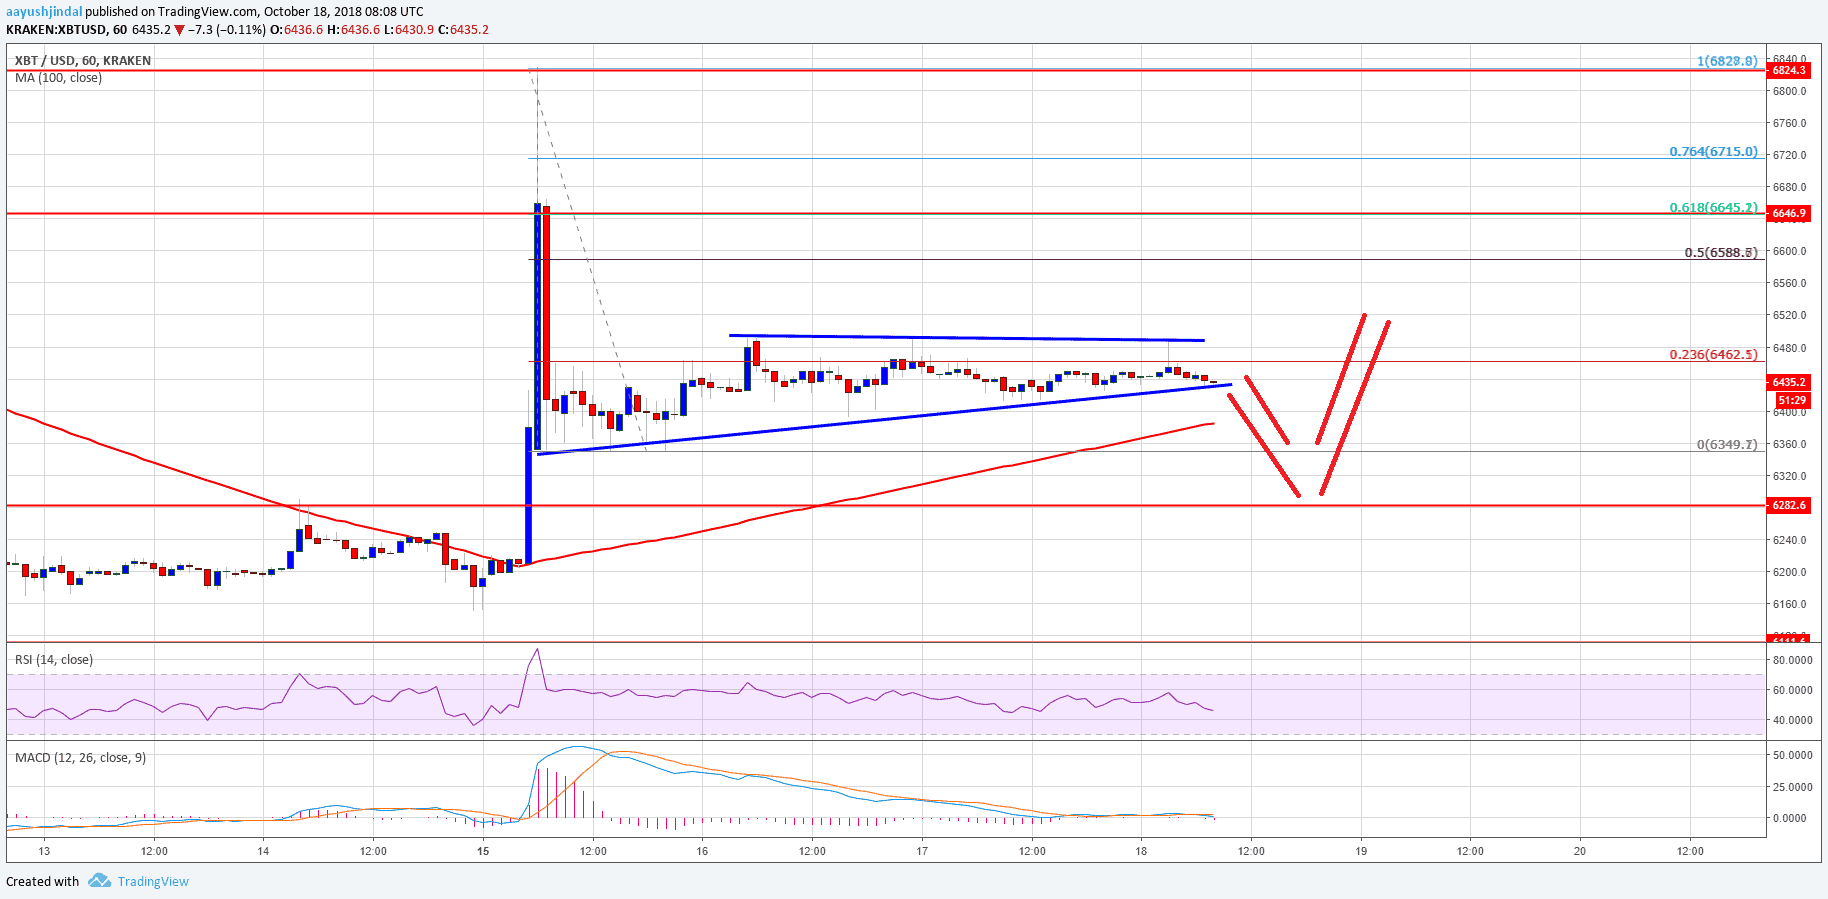
There was an increase in selling pressure noted below the $6,500 and $6,480 levels in bitcoin price against the US Dollar. The BTC/USD pair struggled continuously to break the $6,500 and $6,520 resistance levels. As a result, there was a slight bearish reaction and the price declined below the $6,450 level. It seems like the price failed to settle above the 23.6% Fib retracement level of the previous decline from the $6,828 high to $6,350 swing low.
More importantly, there is a contracting range forming with support at $6,430 and resistance near $6,490. Additionally, there is a crucial bullish trend line in place with support at $6,430 on the hourly chart of the BTC/USD pair. Therefore, if the price breaks the trend line support and $6,410, it could drop towards the $6,380 level and the 100 hourly simple moving average. Below the 100 hourly SMA, the next key support is at $6,280 (the previous resistance). On the flip side, a break above the $6,500 and $6,520 resistance levels could push the price towards $6,590.
Looking at the chart, bitcoin price may continue to trade in a tight range before it either climbs above $6,500 or breaks the $6,430 support in the near term.
Looking at the technical indicators:
Hourly MACD – The MACD for BTC/USD is gaining momentum in the bearish zone.
Hourly RSI (Relative Strength Index) – The RSI has moved below the 30 level.
Major Support Level – $6,400
Major Resistance Level – $6,500
The post Bitcoin Price Watch: BTC/USD Buyers Losing Grip Below $6,500? appeared first on NewsBTC.
Join Our Telegram channel to stay up to date on breaking news coverage


