Join Our Telegram channel to stay up to date on breaking news coverage
Bitcoin (BTC) Price Prediction – April 10
Bitcoin’s rally turned out to be short-lived as it lost almost 10% in the last two days.
BTC/USD Long-term Trend: Bearish (Daily Chart)
Key levels:
Resistance Levels: $8,000, $8,200, $8,400
Support Levels: $6,000, $5,800, $5,600
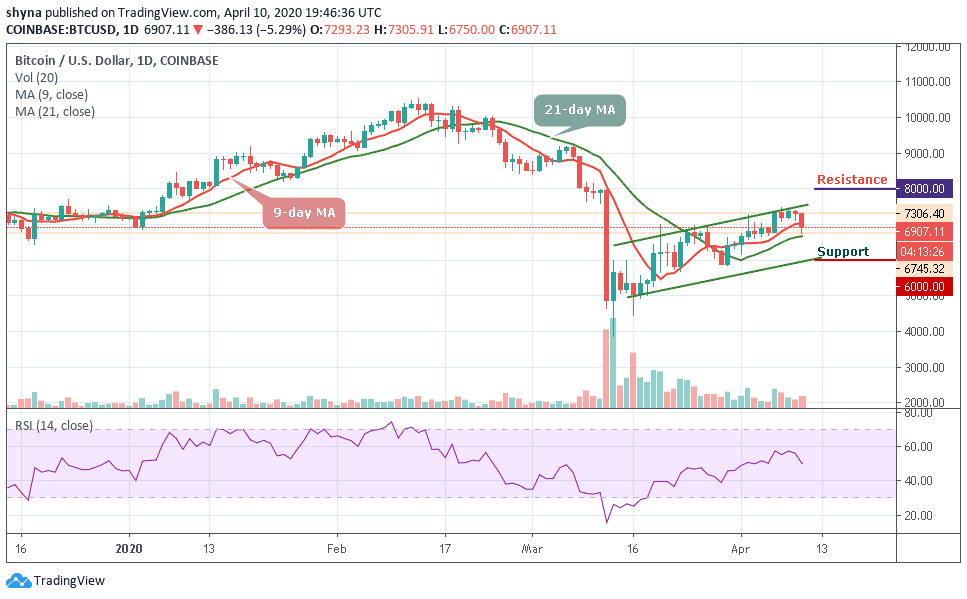
Looking at the daily chart, BTC/USD continues to fall. Within several hours, the flagship cryptocurrency slid from $7,306 to around $6,745 mark. The price is now fluctuating around $6,907. The Bitcoin price crashes below the immediate support as it breached a $6,800 price area. Taking a glance at the price movement of Bitcoin against the USD, we see that the coin had almost a flat movement with a few intermittent highs and lows over the past 48 hours.
According to the chart, Bitcoin is forming a bearish pennant pattern. This pattern, when formed, signals a continuation of the former trend before the consolidation began. The Bitcoin price is still under great risk of breakdown especially if the pattern support is shattered. Moreover, it could be catastrophic for BTC/USD if support at $6,500 gives in, which would encourage more selling, forcing BTC/USD down a painful path with a bearish target on $6,300.
However, BTC/USD is strongly supported at the various former resistance levels include $6,700 and $6,600. Nevertheless, the bulls are also banking on the support at $6,000, $5,800 and $5,600 to ensure that in spite of a reversal, the Bitcoin price stays above $6,900 level. Similarly, the nearest resistance levels to watch for are $8,000, $8,200 and $8,400 respectively. Meanwhile, the RSI (14) drops below 55-level, which may give some bearish signals.
BTC/USD Medium – Term Trend: Ranging (4H Chart)
On the 4-Hour chart, BTC price hovers around $6,899 and may take time to persistently trade above $7,000. More so, if the bulls gather enough strength and regroup, the upward movement may be able to near the $7,200 and $7,400 resistance level.
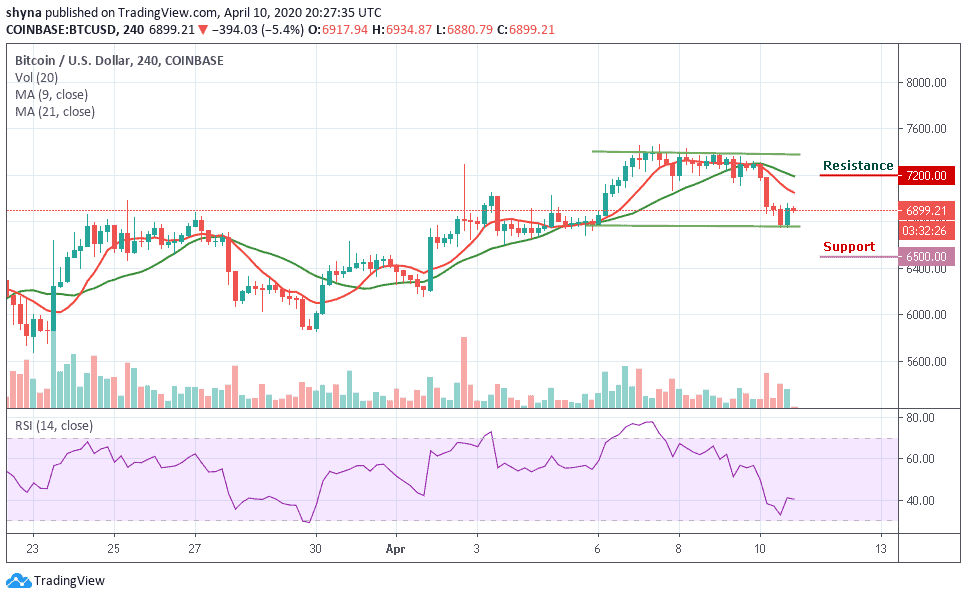
However, on the downside, immediate support is around the $6,700 level while the main support is at the $6,600 level. The price may likely fall below $6,500 if the bears step back into the market, a further movement could test the critical support at $6,300 level. Technically, Bitcoin is currently moving in sideways while the RSI (14) moves above the 40-level, indicating an indecisive in the market movement.
Please note: Insidebitcoins.com is not a financial advisor. Do your research before investing your funds in any financial asset or presented product or event. We are not responsible for your investing results.
Join Our Telegram channel to stay up to date on breaking news coverage