Join Our Telegram channel to stay up to date on breaking news coverage
Bitcoin (BTC) Price Prediction – January 20
Yesterday, Bitcoin (BTC) started a sharp decline from the $9,184 resistance and currently declined towards $8,601, but it is likely to find strong bids near $8,300.
BTC/USD Long-term Trend: Bullish (Daily Chart)
Key levels:
Resistance Levels: $9,400, $9,600, $9,800
Support Levels: $8,000, $7,800, $7,600
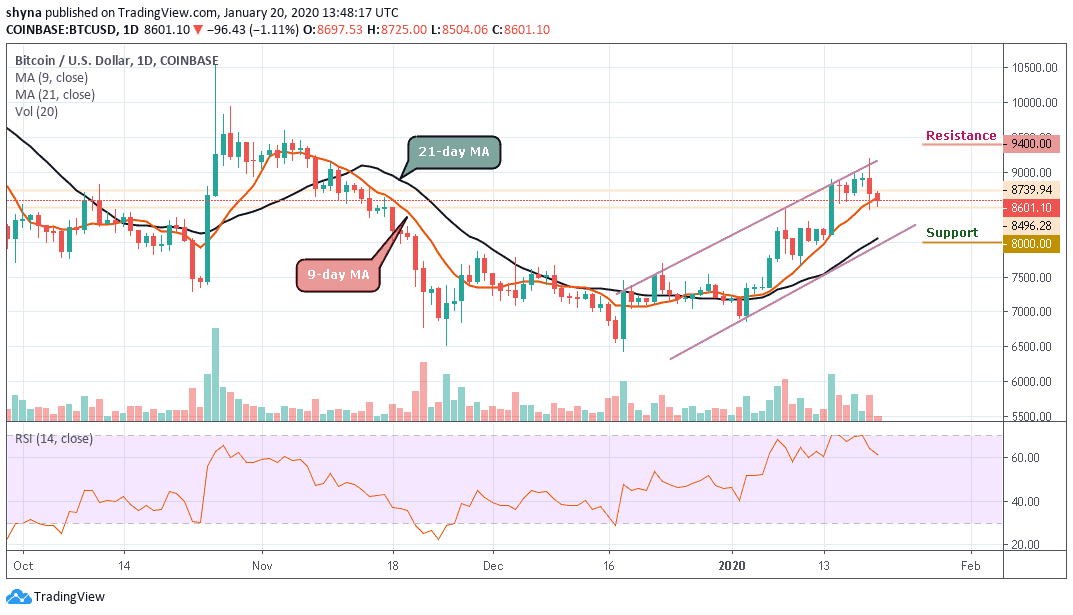
BTC/USD price is down more than 1.0% and it is now trading near the $8,500 level. There was a break below the 9-day moving average with support near $8,450 on the daily chart. The pair is trading above a couple of important supports near $8,200 and $8,100. However, the price faced a strong selling interest near the $8,600 resistance zone. A high was formed near $8,739 and the price started a solid downside correction.
More so, as the Bitcoin price settled below the $8,700 level and the 9-day moving average. It opened the doors for more losses and the price broke the $6,650 level. A low is formed near $8,400 and the price is currently correcting higher. Therefore, BTC/USD needs to climb back above the $8,900 and $9,200 levels to resume its upward move towards $9,400, $9,600 and $9,800.
On the downside, there are a couple of key supports near $8,200 and $8,100. If Bitcoin’s price fails to stay above the $8,300 support, there is a risk of a larger downside correction. The main support is near the $8,400 level, below which BTC/USD is likely to turn bearish and decline towards the support levels of $8,000, $7,800 and $7,600 in the near term as the RSI (14) for the coin is now coming below the 65-level.
BTC/USD Medium-Term Trend: Bullish (4H Chart)
Looking at the 4-Hour chart, BTC/USD trades within the range of $8,474 to $8,744. Nevertheless, Bitcoin has not yet slipped below $8,400 and is still in the loop of making a bounce back. BTC price hovers around $8,630 and may take time to persistently trade above $8,900. The upward movement is facing hurdles near the $9,000 and $9,200 resistance level.
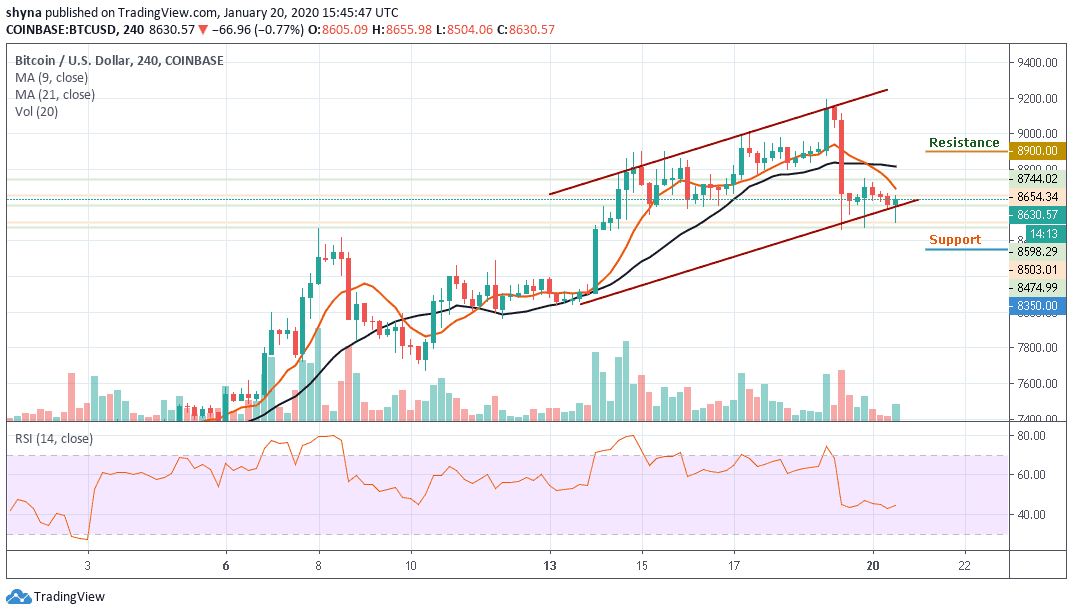
However, on the downside, immediate support is near the $8,500 level while the main support is at the $8,400 level. The price may likely fall below $8,350 because the 9-day MA has already crossed the 21-day MA to face downtrend which may likely test the critical support at $8,250 level. Technically, Bitcoin is currently moving in sideways while the RSI (14) moves in the same direction, indicating indecisive market movement.
Please note: Insidebitcoins.com is not a financial advisor. Do your research before investing your funds in any financial asset or presented product or event. We are not responsible for your investing results.
Join Our Telegram channel to stay up to date on breaking news coverage