Join Our Telegram channel to stay up to date on breaking news coverage
Bitcoin Price Prediction – April 26
The $50,000 support level has now occurred to be the actual extent last support trading zone that a recent downward move would be pushed. Price now sits on a visible promising upswing move from around the level of trading.
BTC/USD Market
Key Levels:
Resistance levels: $60,000, $65,000, $70,000,
Support levels: $50,000, $45,000, $40,000
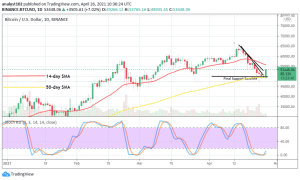
BTC/USD – Daily Chart
As of writing today, the BTC/USD daily chart has showcased the vital instrumental playing role of the bigger SMA’s place of location during crucial trading sessions that took place around the level of $50,000 recently. It now shows a bullish candlestick to potentially signal an end of the market’s correctional move. The 14-day SMA indicator is located a bit over the $55,000 resistance point to the present up-moving of the candlestick. The Stochastic Oscillators have slightly opened the conjoined hairs towards the north from the overbought region to indicate the most possibility of getting to witness a return of upswings in the crypto-economy again.
Will the BTC/USD now sustain moving upward from the $50,000 support area?
Hopefully, it appears that the long-awaited trading scenario has now finally come to play out in favor of the BTC/USD bulls’ run return in the crypto-trade. Technically going by the present pace of a bullish candlestick in the forming, more efforts of pushing further to the north are highly placed on the note. However, the main resistance level to the current pull-up is found around $55,000. A breakout of it will most probably lead price up back into a complete recovery trading outlook of the recent correction afterward.
Regarding projecting a downside for this crypto-economy, presently, it would be technically ideal that bears should suspend their coming into the market for a while. Price may encounter a kind of difficulty to break through the resistance line of $55,000 in a near time. But, it might not create an ideal environment for a reliable sell entry order. Therefore, traders having the mind of going short should wait until another price correction will come to play in another affirmative resistant trading situation afterward.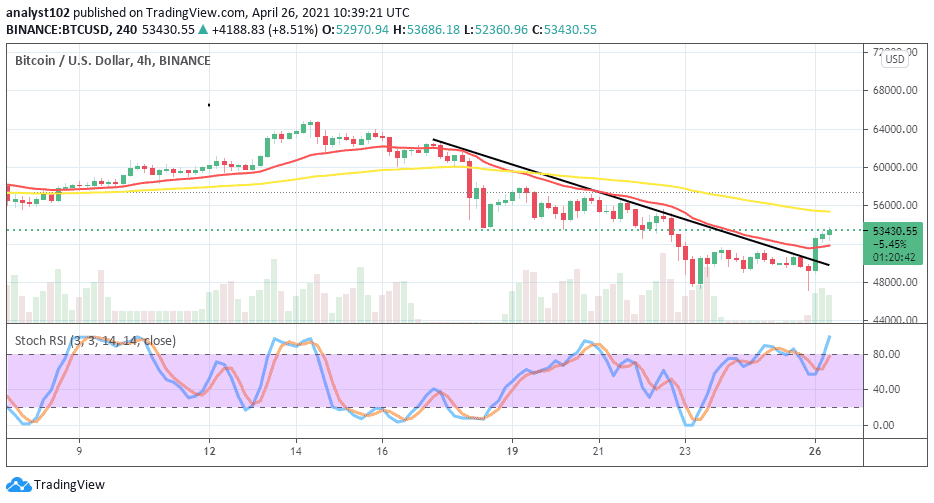
BTC/USD 4-hour Chart
The BTC/USD 4-hour chart now shows that the crypto has embarked on a recovery moving bid as both the small SMA and the bearish drawn trend-lines are being breached to the north. The 50-day SMA indicator is situated around $56,000 over the 14-day SMA trading indicator to signal the key point that price may have to move through in order to be able to affirm the return of uptrend in actual sense. The Stochastic Oscillators have swerved at range 80 crossing the hairs to point towards the north into the overbought region. That signifies a confirmation of the potential looming upswings in the market in a near session.
Join Our Telegram channel to stay up to date on breaking news coverage