Join Our Telegram channel to stay up to date on breaking news coverage
Bitcoin (BTC) Price Prediction – March 27
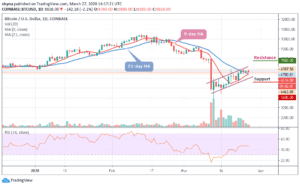
As the daily chart reveals, Bitcoin (BTC) price is facing a growing selling pressure in the zone between $6,800 – $6,900 levels.
BTC/USD Long-term Trend: Bullish (Daily Chart)
Key levels:
Resistance Levels: $7,800, $8,000, $8,200
Support Levels: $5,600, $5,400, $5,200

The attempt of BTC/USD to climb above $7,000 has been satisfied by the increase in the selling activities between $ 6,800 and $ 6,900 level. Similarly, this left the psychological zone at $7,000 to be untested. Meanwhile, the area remains critical for the short-term trend in Bitcoin prices. More so, if BTC/USD continues to stay under $7,000, the sellers’ confidence will continue to grow. At the same time, buyers’ exhaustion will become apparent, culminating in losses towards the support at $6,200.
Moreover, extended losses beneath $6,000 could trigger a fall to $5,500 in a bid to allow more buyers to enter and buy low. BTC/USD has not been able to break above the zone at $7,000, despite the technical picture is healthy. Therefore, more buying entries may increase the trading volume placing the Bitcoin in a formidable rally towards $8,000.
In addition, the market is deciding around the 9-day and 21-day moving averages, where the buyers are anticipating a rebound. Meanwhile, the $7,200 and $7,500 levels may further surface as potential resistances should the $7,000 level holds. However, a strong bullish spike might take the price to $7,800, $8,000 and $8,200 levels. But presently, the RSI (14) is below the 47-level, if the bears clear the $6,000 support, there is a risk of a sharp decline to $5,600, $5,400 and $5,200 support levels.
BTC/USD Medium-Term Trend: Ranging (4H Chart)
Looking at the 4-Hour chart, Bitcoin (BTC) has not yet slipped below $6,000 and is still in the loop of making a bounce back. BTC/USD price hovers below the 9-day and 21-day moving averages and may take time to persistently touch the resistance level of $7,000. At the moment, the Bitcoin price is currently moving around $6,623 level.
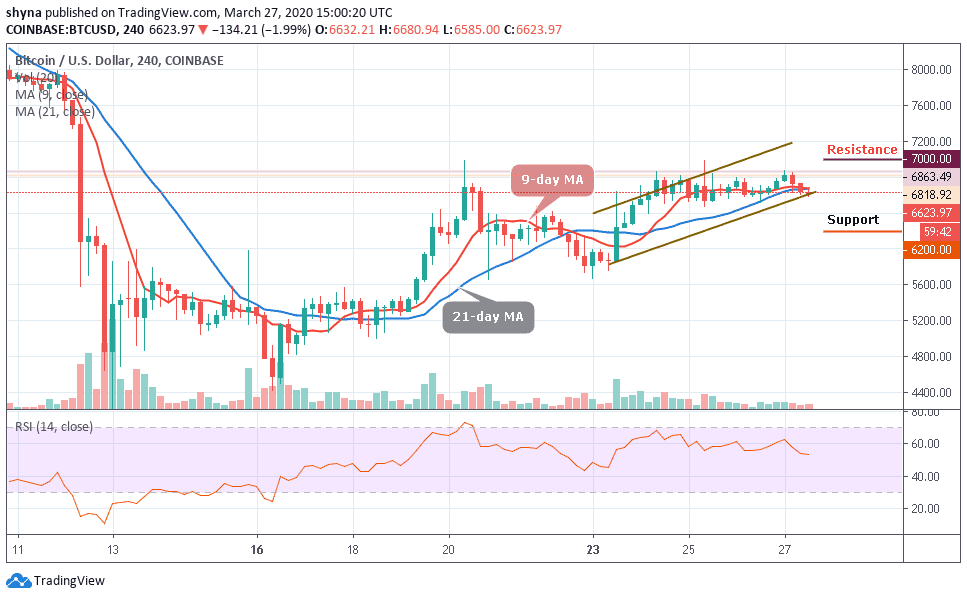
More so, if buyers can put more effort and energize the market, we may expect a retest of $6,800 resistance level. Therefore, breaking this level could also allow the bulls to retest and reach the $7,000, $7,200 and $7,400 upward. In other words, if the bears hold the price and push it below the lower limit of the channel, then the support level of $6,200, $6,000 and $5,800 may be visited as the RSI (14) moves around 54-level.
Please note: Insidebitcoins.com is not a financial advisor. Do your research before investing your funds in any financial asset or presented product or event. We are not responsible for your investing results.
Join Our Telegram channel to stay up to date on breaking news coverage