

Join Our Telegram channel to stay up to date on breaking news coverage
Bitcoin (BTC) Price Prediction – May 2
The price of Bitcoin is trading in a tight range between $8,975 and $8,642 for the past few days.
BTC/USD Long-term Trend: Bullish (Daily Chart)
Key levels:
Resistance Levels: $10,200, $10,400, $10,600
Support Levels: $7,600, $7,400, $7,200
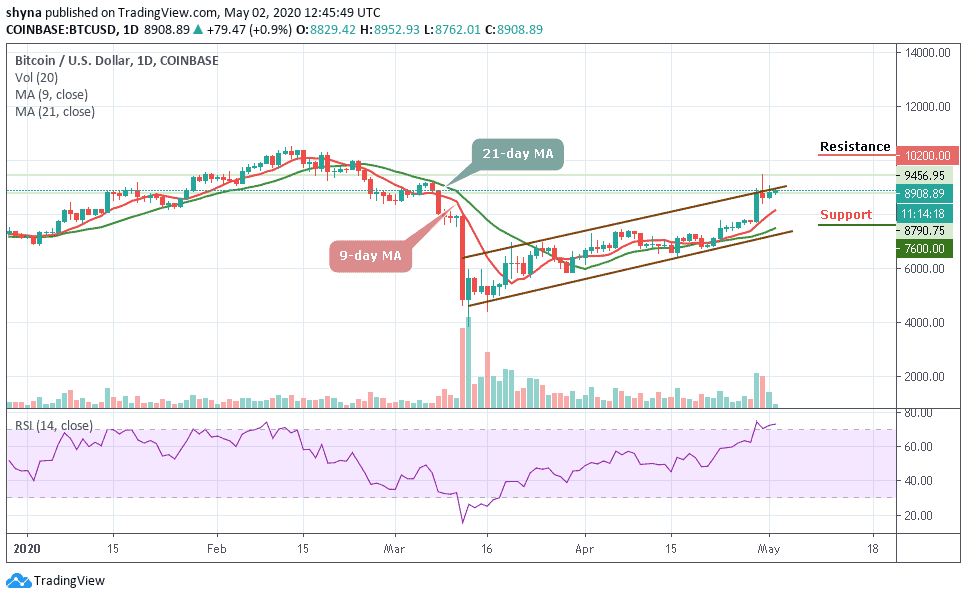
BTC/USD movement on the daily chart has reflected improvement. If the same remains locked, then the expectation of recovery could turn out to be true. BTC/USD is seen trading at $8,908 after soaring to $8,975. The coin then pulled back to where it trading currently and may continue to head downwards if the bears step back into the market.
In addition, the market is deciding around $8,908 around the upper boundary of the channel, where the buyers are anticipating a clear breakout. However, a strong bullish spike above the channel may likely take the price to the resistance levels of $10,200, $10,400 and $10,600.
Moreover, if the market decides to follow the downward trend, Bitcoin’s price may likely drop to the nearest support at $8,400, and should this support fails to contain sell-off, traders may see another drop to the critical supports at $7,600, $7,400 and $7,200.
Meanwhile, the technical indicator RSI (14) reveals that the coin may still be in the bullish movement mode in as much as the signal line remains in the overbought territory. Turning downward may result in immediate supports.
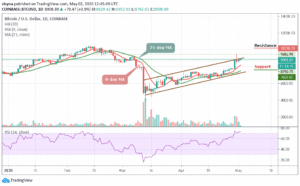
BTC/USD Medium-Term Trend: Ranging (4H Chart)
BTC/USD trades within the range of $8,619 to $9,300. Today, the price of Bitcoin has not yet slipped below $8,700 and is still in the loop of making a bounce back. Currently, the Bitcoin (BTC) is trading around $8,890 and may take time to trade above $9,000. The potential resistance levels to watch are $9,700 and $9,900.

On the downside, the immediate support is near the $8,600 level while the main support is at the $8,400 level. If these supports failed, the coin may likely drop to $8,000 and below. Technically, Bitcoin is currently moving in sideways as the RSI (14) moves above 62-level.
Please note: Insidebitcoins.com is not a financial advisor. Do your research before investing your funds in any financial asset or presented product or event. We are not responsible for your investing results.
Join Our Telegram channel to stay up to date on breaking news coverage
