Join Our Telegram channel to stay up to date on breaking news coverage
Bitcoin (BTC) Price Prediction – July 23
BTC/USD trades above the long-awaited $9,500, buyers may now aim for the $9,700 and $9,800 resistance levels.
BTC/USD Long-term Trend: Bearish (Daily Chart)
Key levels:
Resistance Levels: $9,900, $10,100, $10,300
Support Levels: $9,000, $8,800, $8,600
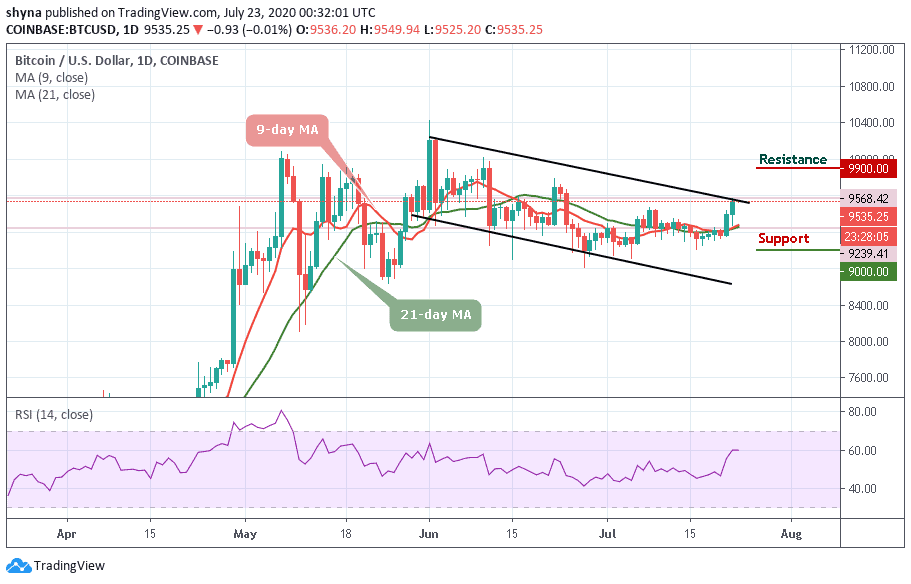
BTC/USD bulls have spiked the price up from $9,239 to $9,568 as yesterday’s trading session came to a close. Buyers will want to continue their momentum in order to push the market prices above the $9,700 and $9,800 resistance level. However, if they manage to do so, then this may likely be the rally that could take BTC/USD back into the much-desired $10,000 resistance zone.
During the Asian and European sessions yesterday, the Bitcoin price pushed for recovery. However, the market is deciding around $9,535 around the upper boundary of the channel, where the buyers are anticipating a clear breakout or breakdown. Meanwhile, the $9,300 and $9,400 levels may further surface as the key resistances should the $9,500 level holds.
Moreover, a strong bullish spike may take the price to $9,900, $10,100, and $10,300 levels. In other words, if the market makes a quick turn towards the south, the Bitcoin price could drop below $9,200 and should this support fails to contain the sell-off, traders may see a further roll back to $9,000, $8,800, and critically $8,600. The RSI (14) suggests an upward movement for the coin as the signal line moves around the 60-level.
BTC/USD Medium – Term Trend: Bullish (4H Chart)
Looking at the 4-hour chart, the bears have been dominating the market for the past few weeks, but the bulls have now stepped back into the market as they intend to push the coin above the channel. If they fail to push the price to the north, the support level of $9,400 and below may come into play.
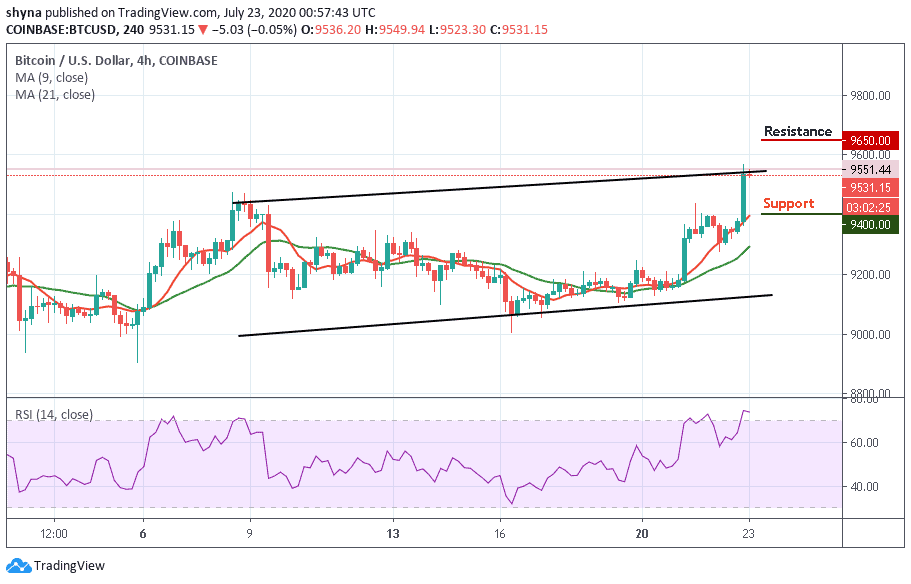
However, if the $9,400 and $9,500 support holds, the coin may continue its upward movement. Similarly, the first digital coin is within the overbought territory of the daily RSI which indicates that the market is in bullish momentum. The market price may continue to experience a bullish movement in as much as the 9-day MA is moving above the 21-day MA.
Join Our Telegram channel to stay up to date on breaking news coverage