Join Our Telegram channel to stay up to date on breaking news coverage
Bitcoin (BTC) Price Prediction – March 17
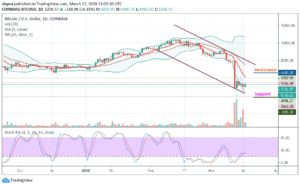
The Bitcoin bulls’ comeback is sending the price towards $6,000 but momentum stalls at $5,456.
BTC/USD Long-term Trend: Bearish (Daily Chart)
Key levels:
Resistance Levels: $6,600, $6,800, $7,000
Support Levels: $3,800, $3,600, $3,400

The daily chart has revealed that BTC/USD is back to trading above $5,000 following a bearish correction to levels under $4,500. Today, the Asian session is characterized by a renewed upward trend whereby BTC/USD has recovered from intraday lows at $4,889 to highs around $5,456. More so, Bitcoin’s price is currently hovering 4.35% higher on the day at $5,456 around the lower boundary of the Bollinger bands. So, in spite of the upward movement, BTC/USD is still facing a bearish trend and high volatility.
At the time of writing, the BTC price is trading in a range of $4,889 to $5,668. It has created a short-term double-bottom which suggests that the price may soon break out from this range and head above $6,000. On a bullish note, looking at the technical indicator stochastic RSI, the signal lines have broken out from a descending resistance line which suggests that the Bitcoin price will once again move towards $5,500, which is the closest resistance level.
However, a strong bullish spike may take the price to $6,600, $6,800 and $7,000 resistance levels. Moreover, if the market makes a quick turn to the south, the BTC/USD price may likely drop to $4,000 and should this support fails to contain the sell-off, traders may see a further roll back to $3,800, $3,600 and critically $3,400. The stochastic RSI suggests an upward movement for the coin as the signal lines move towards the north.
BTC/USD Medium – Term Trend: Ranging (4H Chart)
Looking at the 4-Hour chart, BTC/USD trades within the range of $4,391 to $6,008. Nevertheless, the coin has not yet moved below $4,000 and still in the loop of breaking or making a bounce back. BTC price hovers around $5,339 and may take time to persistently trade above $6,000. The upward movement may be able to near the $6,300 and $6,500 resistance levels if the bulls regroup.

However, on the downside, immediate support is around the $4,800 level while the main support is at the $4,600 level. The price may likely fall below $4,400 if the bears step back into the market, a further movement could test the critical support levels at $4,200 and $4,000 respectively. Technically, Bitcoin is still moving in sideways while the RSI (14) moves in the same direction, indicating an indecisive in the market movement.
Please note: Insidebitcoins.com is not a financial advisor. Do your research before investing your funds in any financial asset or presented product or event. We are not responsible for your investing results.
Join Our Telegram channel to stay up to date on breaking news coverage