Join Our Telegram channel to stay up to date on breaking news coverage
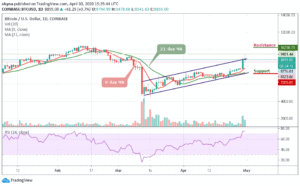
Bitcoin (BTC) Price Prediction – April 30
The Bitcoin price has recovered from the recent low on approach to $8,523 but the Bulls may have trouble taking the price above $9,500.
BTC/USD Long-term Trend: Bullish (Daily Chart)
Key levels:
Resistance Levels: $10,200, $10,400, $10,600
Support Levels: $7,200, $7,000, $6,800
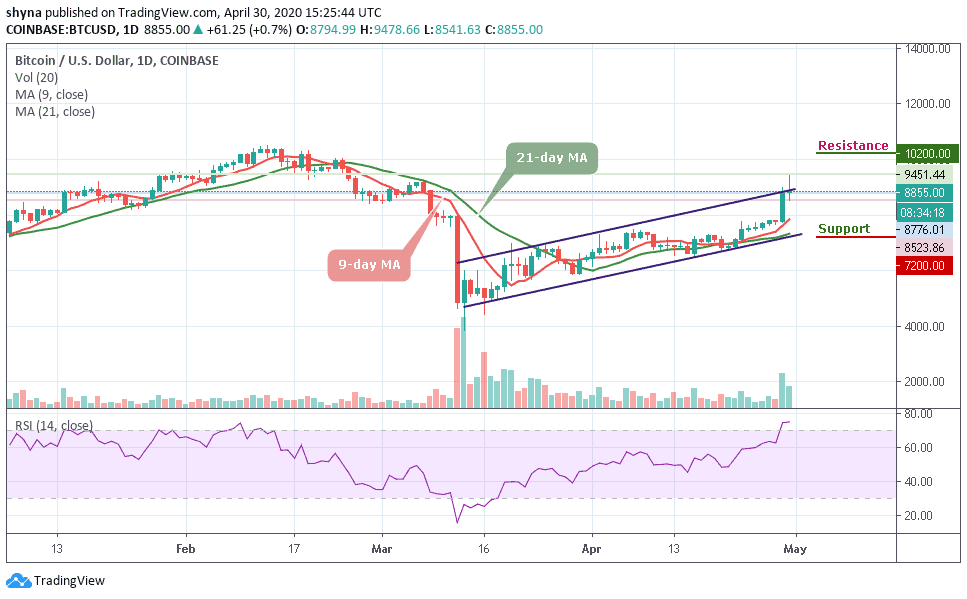
Today, BTC/USD continued the upside trend to touch $9,451.44 during early Asian hours. At the time of writing, BTC is changing hands at $8,855 after recovery from the recent low of $8,523. A sustainable move above $9,500 may bring $10,500 back into focus which was February 2020 high. The coin after touching $9,451 has gained above 2% since the beginning of the day but later moved back to 8,523.
Looking at the daily chart, BTC/USD is still maintaining the movement above the 9-day and 21-day moving averages. This area creates the first line of support that may aid the bullish movement. Considering that the RSI (14) has found itself within the overbought zone, However, BTC/USD may retest $9,400 before moving to the potential resistance at $10,200 but if $10,400 surface, the, $10,600 may come into focus.
Therefore, any failure by the bulls to move the price up may see a price cut to $8,000 vital support. A further low drive could send the price to $7,200, $7,000 and $6,800 supports. For now, the bulls are still controlling the market. But with a look of things, the Bitcoin price may likely experience some drops before moving higher as the RSI (14) is at the overbought zone.
BTC/USD Medium-Term Trend: Bullish (4H Chart)
At the opening of the market today, the Bitcoin price first went up to touch $9,485 but has dropped to $8,563 within 24 hours, taking its price to where it is currently trading at $8,794. Should the price continue to drop further and move below the 9-day moving average, it could reach the nearest support levels at $7,900 and beyond.
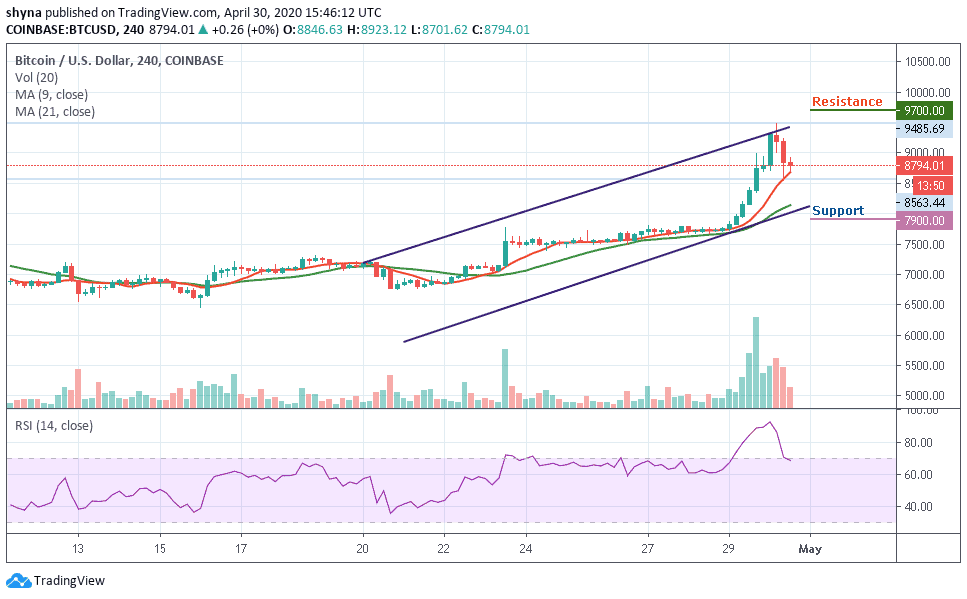
In other words, if the bulls resume back and push the coin above the upper boundary of the channel, the price of Bitcoin may likely reach the potential resistance levels of $9,700 and above. Presently, the market may follow the downward trend as the RSI (14) indicator nosedives below 70-level.
Please note: Insidebitcoins.com is not a financial advisor. Do your research before investing your funds in any financial asset or presented product or event. We are not responsible for your investing results.
Join Our Telegram channel to stay up to date on breaking news coverage