Join Our Telegram channel to stay up to date on breaking news coverage
Bitcoin (BTC) Price Prediction – March 31
BTC/USD price is trading nicely above $6,400 and the coin must climb the crucial $7,000 resistance to continue higher.
BTC/USD Long-term Trend: Bullish (Daily Chart)
Key levels:
Resistance Levels: $7,800, $8,000, $8,200
Support Levels: $5,000, $4,800, $4,600

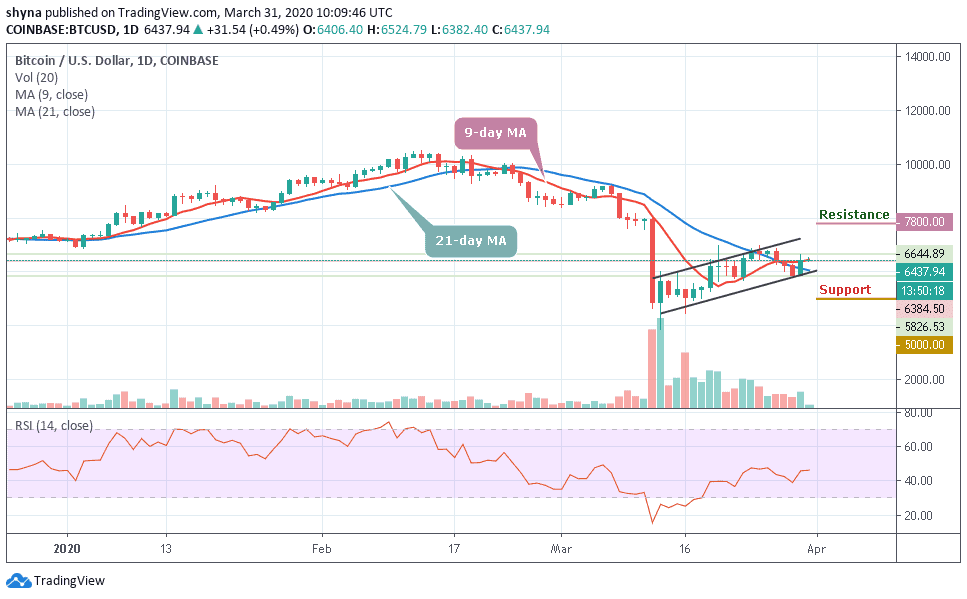
Yesterday, the BTC/USD increased significantly over the course of the day as the price opened at $5,863 but created a bullish engulfing candlestick that reached a high of $6,644 and closed at $6,421. More so, BTC/USD is currently trading at $6,437 as the price corrected higher with a gain of 0.49% at the beginning of the day. Strongly bullish momentum is contributing to nurturing an uptrend targeting $7,000 in the short-term.
However, the market is deciding above the 9-day and 21-day moving averages, where the buyers and sellers are anticipating a clear breakout or breakdown. BTC/USD is technically ready to take on the resistance at $6,800 but low trading volume still limits gains. Nonetheless, a strong bullish spike may push the price to $7,800, $8,000 and $8,200 levels.
Moreover, if the market makes a quick turn and follows the downtrend, the Bitcoin price may drop to $6,000 and should this support fails to contain the sell-off; traders may see a further roll back to $5,000, $4,800 and critically $4,600. The RSI (14) suggests a sideways movement for the coin as the signal line moves in the same direction.
BTC/USD Medium-Term Trend: Bullish (4H Chart)
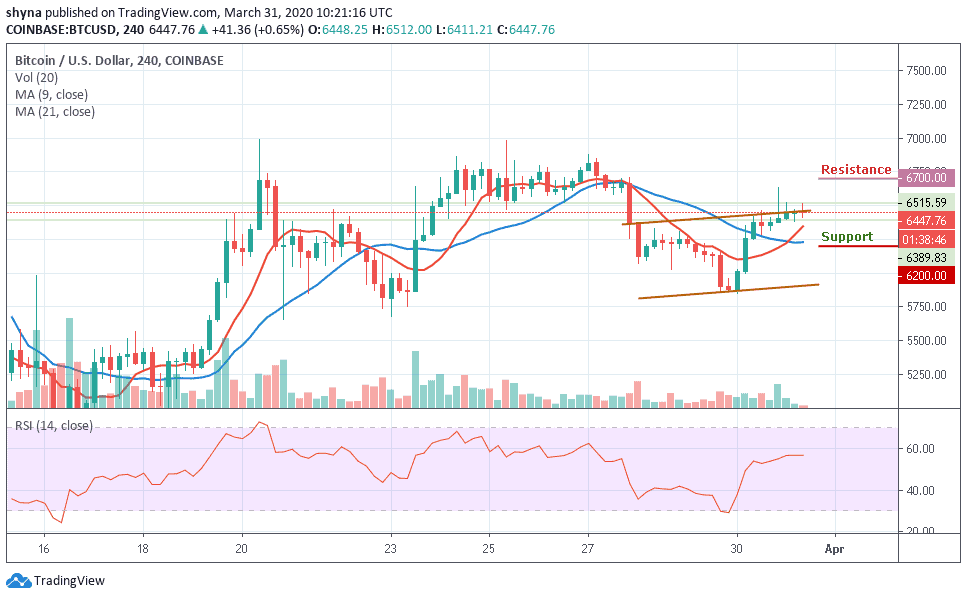
Looking at the 4-hour chart, the bears wanted to step back into the market but the bulls quickly held the support by picking the price from $6,389 to where it is currently trading at $6,447 which is still above the 9-day and 21-day moving averages. Meanwhile, the $6,700 and above may come into play if BTC/USD breaks above the channel.

However, if the price breaks below the moving averages of the ascending channel and begins to fall, the support levels of $6,200 and below may come to play. Meanwhile, the technical indicator RSI (14) is seen moving above 55-level, more bullish signals may surface before a reversal could come in.
Please note: Insidebitcoins.com is not a financial advisor. Do your research before investing your funds in any financial asset or presented product or event. We are not responsible for your investing results.
Join Our Telegram channel to stay up to date on breaking news coverage

