Join Our Telegram channel to stay up to date on breaking news coverage
Bitcoin (BTC) Price Prediction – May 1
The price of Bitcoin is seen trading nicely above the $8,727 and the coin must climb above the $9,000 resistance to continue higher.
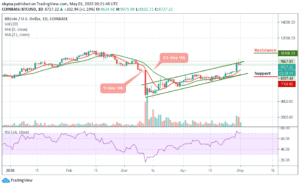
BTC/USD Long-term Trend: Bullish (Daily Chart)
Key levels:
Resistance Levels: $10,100, $10,300, $10,500
Support Levels: $7,100, $6,900, $6,700

BTC/USD bulls may slowly come back into action after a minor battering from the bears yesterday. If this happens, then the expectation of recovery could turn out to be true. Today, BTC/USD was seen trading at $8,557 after soaring to $9,067.89. The coin then pulled back to where it is trading currently at $8,727 and may continue to head upwards if the bulls maintaining the trend.
However, the market is deciding above the 9-day and 21-day moving averages, where the buyers and sellers are anticipating a clear breakout or breakdown. Meanwhile, the $8,900 and $9,000 levels may further surface as the key resistances should the $8,800 level come to play. However, a strong bullish spike may take the price to $10,100, $10,300, and $10,500 levels.
Moreover, if the market makes a quick turn to the south, the BTC/USD price may likely drop to $8,500, and should this support fails to contain the sell-off, traders may see a further roll back to $7,100, $6,900 and critically $6,700. The technical indicator RSI (14) suggests an upward movement for the coin as it stays within the overbought zone.
BTC/USD Medium-Term Trend: Bullish (4H Chart)
The 4-hour chart for BTC is still looking bullish, but the market has been showing a sign of weakness after some periods that the market opens today. However, the intraday trading is now looking bearish; following the recent downtrend to $8,656 which is now a key support level. The next key support levels are $7,800, $7,600, and $7,400.
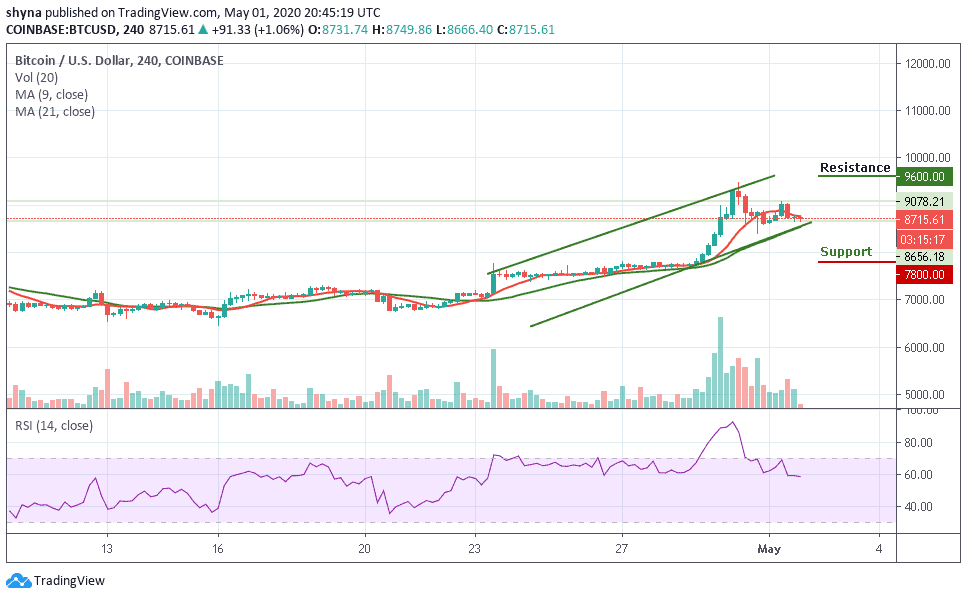
However, considering the recent early rebound, the Bitcoin price may re-enter the bullish rally to $9,200 resistance. A climb above the mentioned resistance may further push BTC price to $9,600, $9,800, and $10,000 resistance levels. As it appeared now, it seems the bears may likely return into the market as the RSI (14) moves below 60-level which could trigger the downward direction.
Please note: Insidebitcoins.com is not a financial advisor. Do your research before investing your funds in any financial asset or presented product or event. We are not responsible for your investing results.
Join Our Telegram channel to stay up to date on breaking news coverage