Join Our Telegram channel to stay up to date on breaking news coverage
Bitcoin (BTC) Price Prediction – August 20, 2020
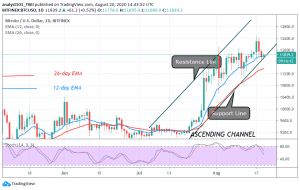
Yesterday, BTC/USD bearish run came to a temporary end as the coin found support above $11,600. Today, the king coin has resumed an upward move as it trades marginally above $11,700. The coin is currently consolidating above $11,600 support.
Resistance Levels: $10,000, $11, 000, $12,000
Support Levels: $7,000, $6,000, $5,000

The recent breakout failed because the bulls were unable to sustain the bullish momentum on the upside. Nonetheless, after the failed breakout, BTC found support above $11,600. Certainly, the crucial support level for the king coin is between $11,400 and $11,600. BTC will recover when price holds above these support levels. In other words, as long as BTC holds above these levels, a further upward move will resume.
On August 7 and August 11, price dropped to this support level and rebounded. Yesterday, BTC rebounded above $11,600 as the coin continued the upward move. Conversely, if the $11,400 to $11,600 level is broken, a drop to $11,000 and $11,200 is likely. BTC is below 80% range of the daily stochastic. However, the bearish momentum has subsided as the price action shows bullish signals.
Bitcoin “Black Thursday” Repeat, May Not Hold
Bitcoin “Black Thursday” was on a Thursday on March 12 where Bitcoin crashed to as low as $3,800. Bitcoin traders and investors were gripped with fear as there was panic selling and stop losses were being hit. This “Black Thursday” happened after the $10,000 resistance was retested. The crypto dropped more than 50% but it rebounded later.
Nonetheless, there are fears that Bitcoin may likely crash as it pulled back from the $12,000 resistance. The fears have been allayed because exchanges hold less BTC to be sold off. The Bitcoin exchange reserve metric shows how much BTC is held at exchanges. When the exchange metric shows a low figure, it implies that investors have withdrawn their holdings from the exchange to secure permanent storage.
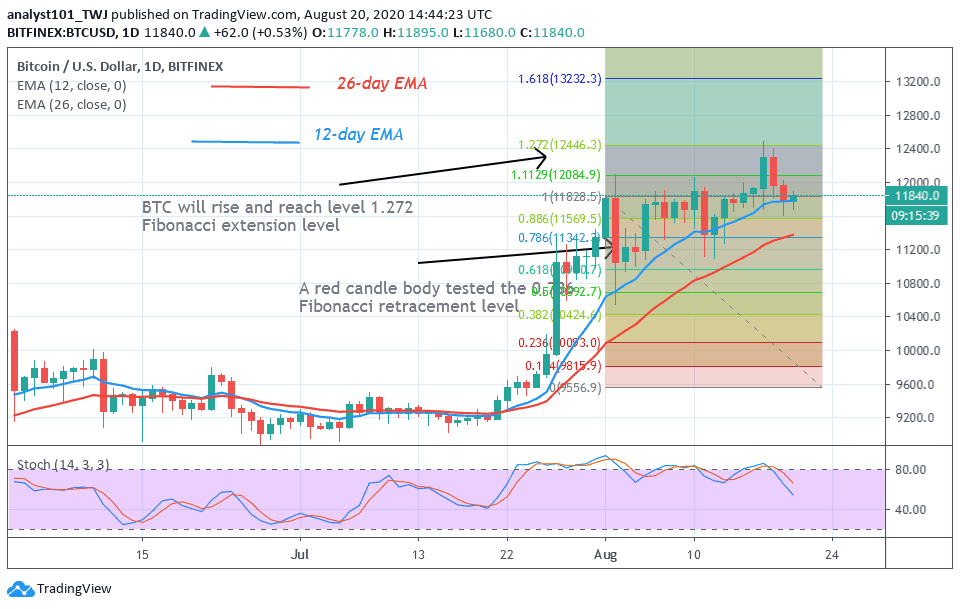
Meanwhile, BTC has resumed a fresh uptrend. A red candle body tested the 0.786 Fibonacci retracement level. BTC will rise and reach level 1.272 Fibonacci extension level ($12,400). Bitcoin price will be accelerated once the resistance is broken. However, buyers may face selling pressure at $12,000.
Join Our Telegram channel to stay up to date on breaking news coverage