Join Our Telegram channel to stay up to date on breaking news coverage
Binance Coin Price Prediction – September 29
The trending outlook in the BNB/USD trade operations showcases the crypto economy strives for a hike in a low-active moving mode. Yesterday’s trading session witnessed that price traded between $266.98 and $283.34 value lines. Presently, the market possesses a minute percentage rate of 0.46 positive.
Binance Coin Price Statistics:
BNB price now – $282.80
BNB market cap – $46.6 billion
BNB circulating supply – 161.3 million
BNB total supply – 161.3 million
Coinmarketcap ranking – #5
Binance Coin Market
Key Levels:
Resistance levels: $300, $330, $360
Support levels: $250, $225, $200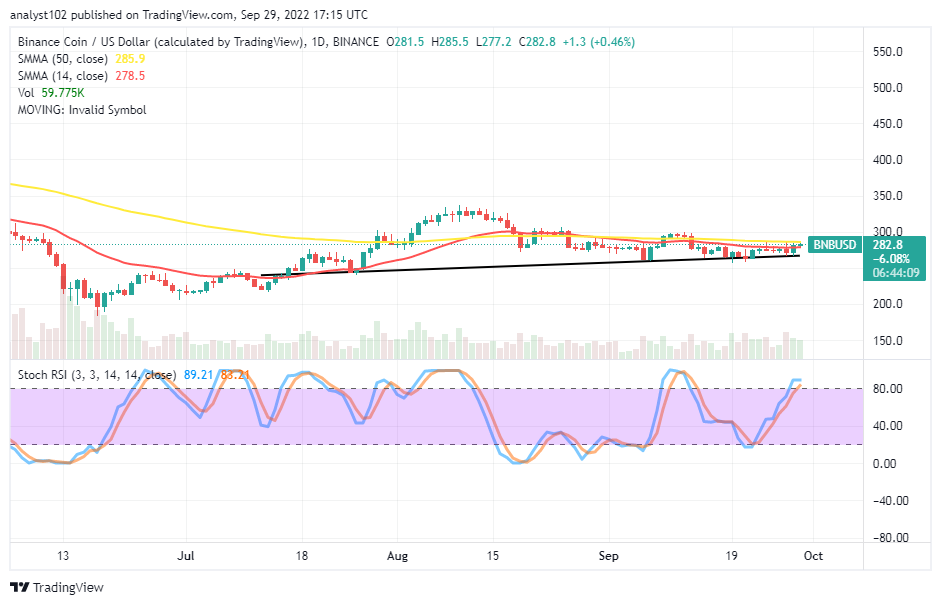
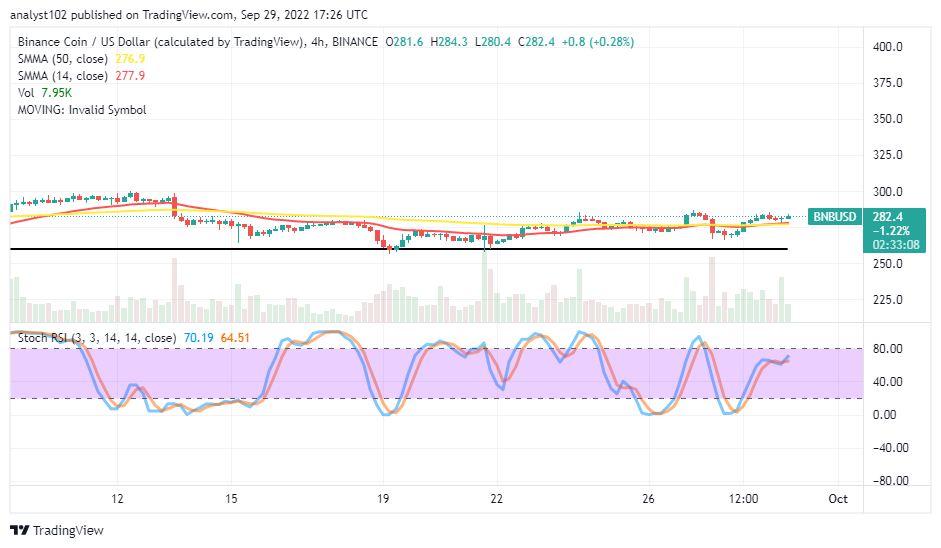
The daily chart showcases the trading situation between Binance Coin and the US Dollar strives for a hike. The 14-day SMA indicator is at $278.50 underneath the 50-day SMA indicator, which is at $285.90. The bullish trend line drew at a close range point beneath the SMA trend lines to depict the market is relatively pushing at an average high-trading pace. The Stochastic Oscillators have penetrated the overbought trading region, seemingly attempting to close their lines back southbound at 89.21 and 83.21 range values.
Your capital is at risk
Will there be more reliable upward pushes above the BNB/USD market‘s current trading zone soon afterward?
The BNB/USD market price strives to hike around the trend line of the SMAs. The current trading trend in the crypto trade operations portends a relatively bullish-running outlook. The situation appears bulls will be taking time before resuming a durable upward-moving cycle. To that end, buyers may have to wait for the reading posture of the Stochastic Oscillators to give lower range values close to or around the oversold region before backing their re-buying entry order while a significant bullish candlestick emerges from a lower-trading zone.
On the downside of the technical analysis, the BNB/USD market bears may have to be alert when any spike around the trend lines of the SMAs coupling with an active retracement motion after hitting resistance around $300 before considering the execution of a selling order. Alternatively, short-position placers may resort to the launching of a sell limit order position a bit over the resistance level mentioned above.
BNB/BTC Price Analysis
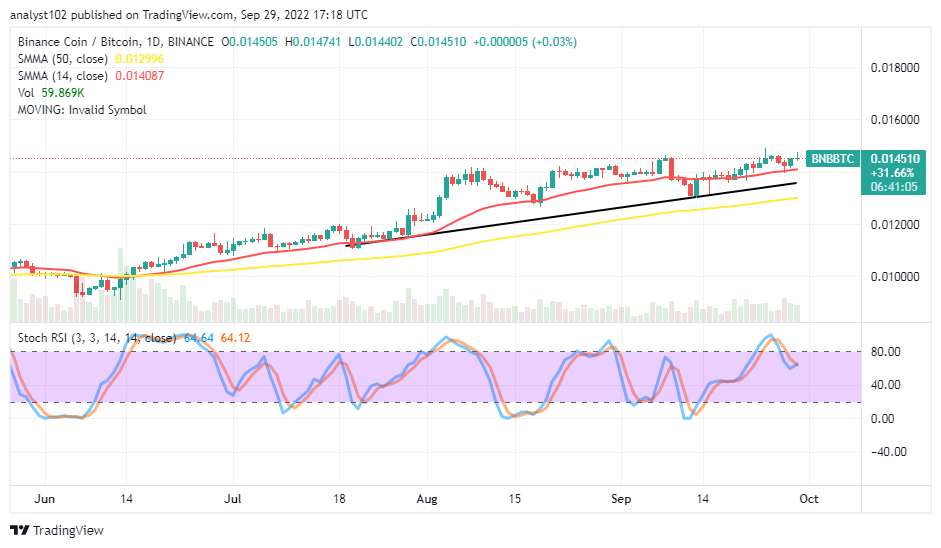
In comparison, the trending outlook between Binance Coin and Bitcoin still showcases on the price analysis chart the pairing crypto price strives for a hike around the smaller SMA trend line. The 14-day SMA indicator is above the 50-day SMA indicator. The bullish trend line is drawn between the SMA trend lines, touching the logical point that the price has been swinging upward back in the continuation of a bullish trend. The Stochastic Oscillators have moved southbound from the overbought region, seemingly attempting to close back at the 64.12 and 64.64 range values.
Read more:
Join Our Telegram channel to stay up to date on breaking news coverage
