Join Our Telegram channel to stay up to date on breaking news coverage
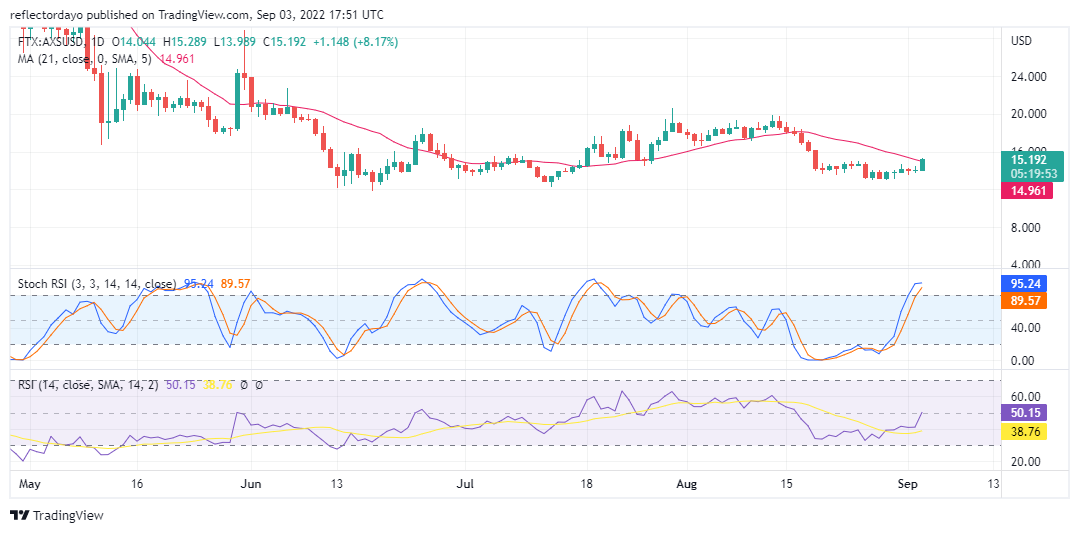
Strong bullish activities in today’s AXS/USD market have brought the price up from the downside to hit the 21-day moving average. After the price consolidation that followed very bearish market momentum in August, increasing buying pressure during the price consolidation period signals the imminent uptrend. Before today’s strong bullish market performance and when we look at the market activities in the consolidation period, we would see that the selling momentum was reducing as buying momentum was increasing. On the 30th of August, bought buyers and sellers tried to pull the price to their side, but none of them succeeded. The market for that day marks the beginning of a bullish market.
Axie Infinity Market Price Statistic:
- AXS/USD price now: $15.191
- AXS /USD market cap: $1,265,016,200
- AXS /USD circulating supply: 83,351,169.97
- AXS /USD total supply: 270,000,000
- AXS /USD coin market ranking: #42
Key Levels
- Resistance: $16.139, $17.896 $20.000
- Support: $13.160, $12.778, $11.937
Your capital is at risk
Axie Infinity Market Price Analysis: The Indicators Point of View
Although in the stochastic indicator, price actions appear to be in the overbought zone, we cannot conclude that the price is being overbought. This is because the stochastic indicator is fast. That is why sometimes prices appear to linger in the overbought zone for days. This is the reason why we need to employ the Relative Strength Index. The Relative Strength Index is a slower indicator. And in our market today, we see that the RSI line has just touched the 50% level which is the demarcation between a strong market and a weak market. From the information we got from the RSI, the price level is just coming up from the price dip. And it still has a long way to go to confirm the bullish trend.
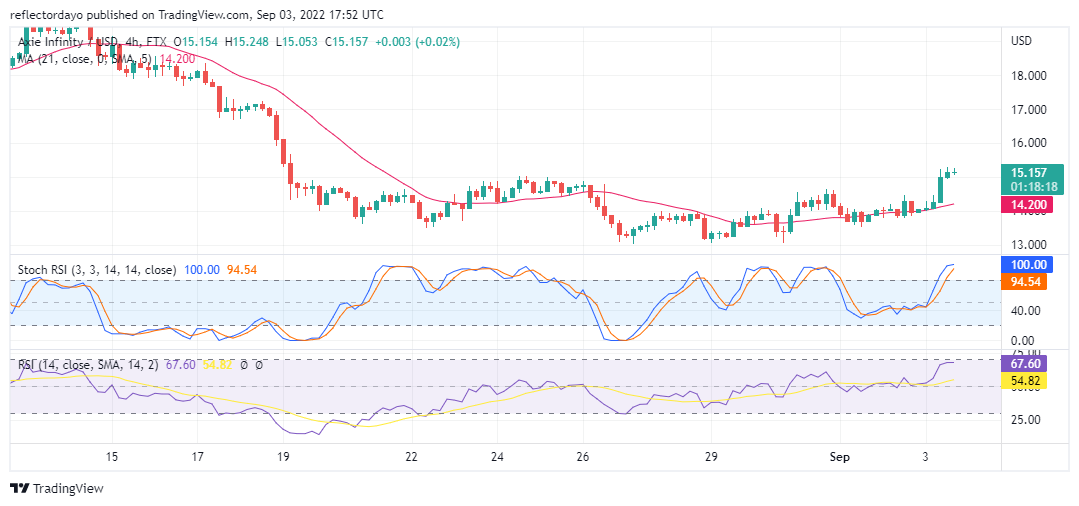
Axie Infinity Analysis: AXS/USD 4-Hour Chart Outlook
On the 4-hour chart, we can conclude that the buyers dominate today’s market without leaving space for the sellers. This can be a confirmation that the buyers are still fit to push the market. On the other hand sellers’ activities can still be felt in the market, but they are not as strong as the buyers’ impact on the market today. The RSI line is ranging at 67.57%. The price action may be heading towards $16.000
Related
Join Our Telegram channel to stay up to date on breaking news coverage