Join Our Telegram channel to stay up to date on breaking news coverage
Initially, the forces of demand and supply were evenly matched. But when the bulls market made a strong move, the bears market responded with a stronger move. This was how the bear market began to have the upper hand. Today’s Axie Infinity market was at first bullish, the price breaking multiple resistance, but bears regain control when the bullish price climaxed above the $12 price level.
Axie Infinity Market Price Statistic:
- AXS/USD price now: $7.89
- AXS/USD market cap: $698,923,040
- AXS/USD circulating supply: 96,194,370.51
- AXS/USD total supply: 270,000,000
- AXS/USD coin market ranking: #56
Key Levels
- Resistance: $8.00 $9.00, $10,00
- Support: $7.00, $6.00, $5.00
Axie Infinity Market Price Analysis: The Indicators’ Point of View
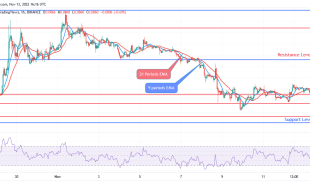
On November 10, after the bulls took their support for $6.00 for an upswing, aiming at recovering the bullish price, they encounter strong resistance at the $7.38 price level. Today’s bulls market aims at breaking away from this narrow price channel with a massive bullish breakout, but due to bearish resistance, the price is now back at around the same $7.38 price level. The upper band of the Bollinger is not affected by the strong earlier bullish move, but the lower band is moving downward. This shows us that the selling pressure is slightly stronger than the buying pressure. And the appearance of the candlestick that represents today’s market may be an indication that the price may yet fall again.
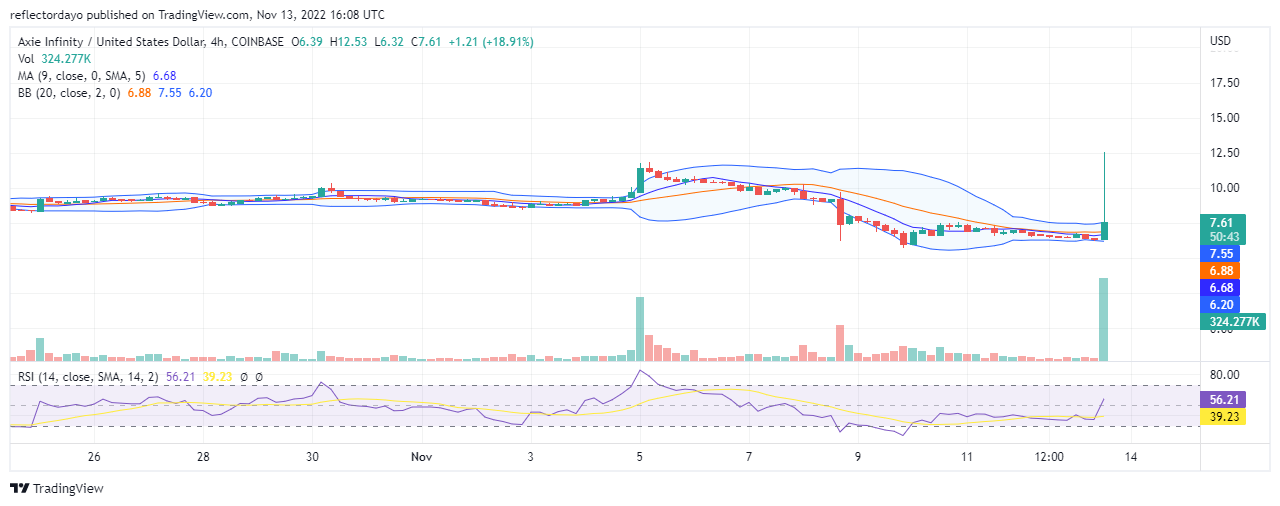
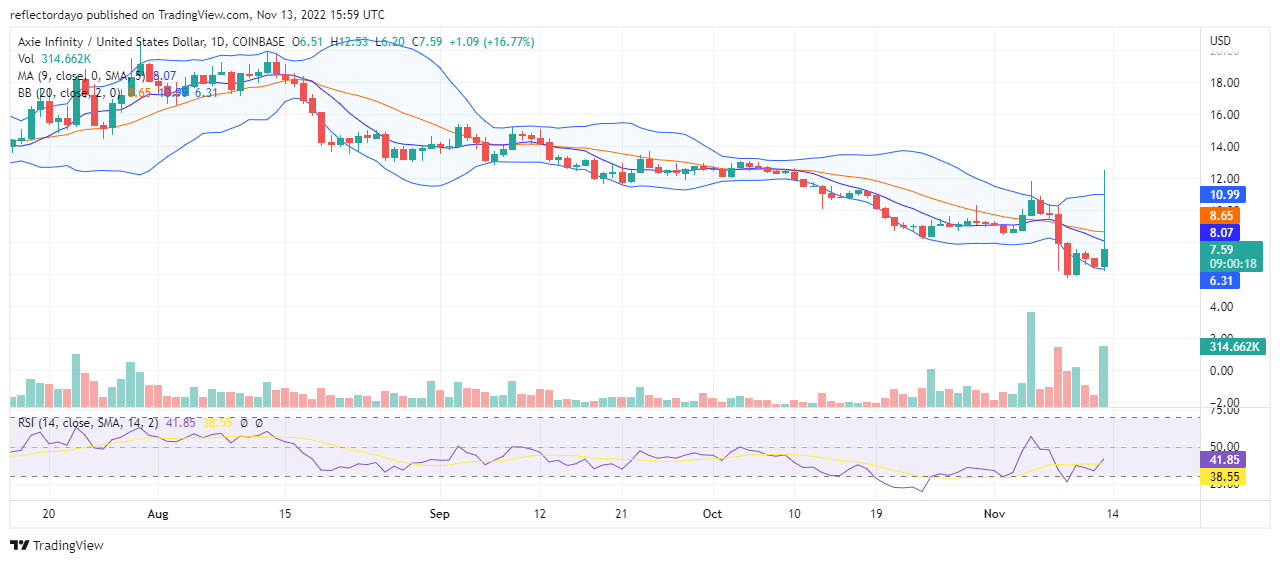
AXS/USD 4-Hour Chart Outlook
The Bollinger Indicator is showing us that the price is slightly below the sell zone: the price is below the 9-day moving average. This is contrary to the RSI which shows the line measuring 55 in the indicator. The reason for this difference between the two indicators may be because of the slight bearish pressure that is keeping the price below the $7.38 resistance level. If buyers can maintain the bullish market price of today, they may be able to secure a support at this level that will help them to swing the price higher.
Bitmart Will Be Listing D2T After the Presale
BitMart now has Dash 2 Trade among its list after the presales. Also, LBank will also be listing Dash 2 Trade. D2T presale is selling very fast, and it has now raised $6m for the future development of the platform.
Related
Join Our Telegram channel to stay up to date on breaking news coverage