Join Our Telegram channel to stay up to date on breaking news coverage
Injective price turned bullish on Sept. 12, rising as much as 16% from $6.5 to a record high above $7.5 on Sept. 19. However, the price turned down from that level after sellers regained control of the market as they booked profits immediately after.
INJ is among the top crypto gainers today after climbing 3% in the last 24 hours, according to data from CoinMarketCap. Its 24-hour trading volume is up 20% daily to $20.2 million. With a live market cap of $608 million, Injective is ranked at #58 on the CoinMarketCap ranking.
INJ’s price action has been remarkable in 2023, following a long period of consolidation at the end of 2022, when the buyers and the sellers fought for control. The 74% year-to-date (YTD) rally has seen the Injecive price break through key stubborn resistance levels, including all the major moving averages.
This provided the tailwinds required by INJ to scale to a new high on the upside, reaching a YTD high of $10.
Given the recent recovery, the Injective bulls appear determined to push the token back to these levels, with investors hoping that its value will continue to grow.
Injective Bulls Eye Return to $8
INJ was trading at $6.9 on Sept. 8, but the price began to drop towards the end of the day, declining nearly 8% from the day’s high to find support around the $6.50 demand zone.
The Injective price bounced off the support at $6.5, rallying 16% to $7.537. Selling pressure from the 100-day Simple Moving Average (SMA) which sat at $7.56, saw the price turndown to find consolation from the $6.89 buyer congestion zone, preventing the price from dropping lower in Sunday’s session.
This price action has formed a bullish flag chart pattern in the daily chart below. This highly bullish technical pattern indicates that the INJ uptrend may continue in the near term.
Accordingly, the price broke through the resistance provided by the flag’s upper boundary at $7.0 on Monday, confirming the technical chart pattern. This pointed to the continuation of the uptrend, with the first line of resistance emerging from the 50-day SMA at $7,18, which INJ shattered earlier today.
If bulls can keep the price above this level, they will set the path for INJ to reach the technical target of the governing chart pattern at $8.11. This would represent an 11% uptick from the current price.
INJ/USD Daily Chart
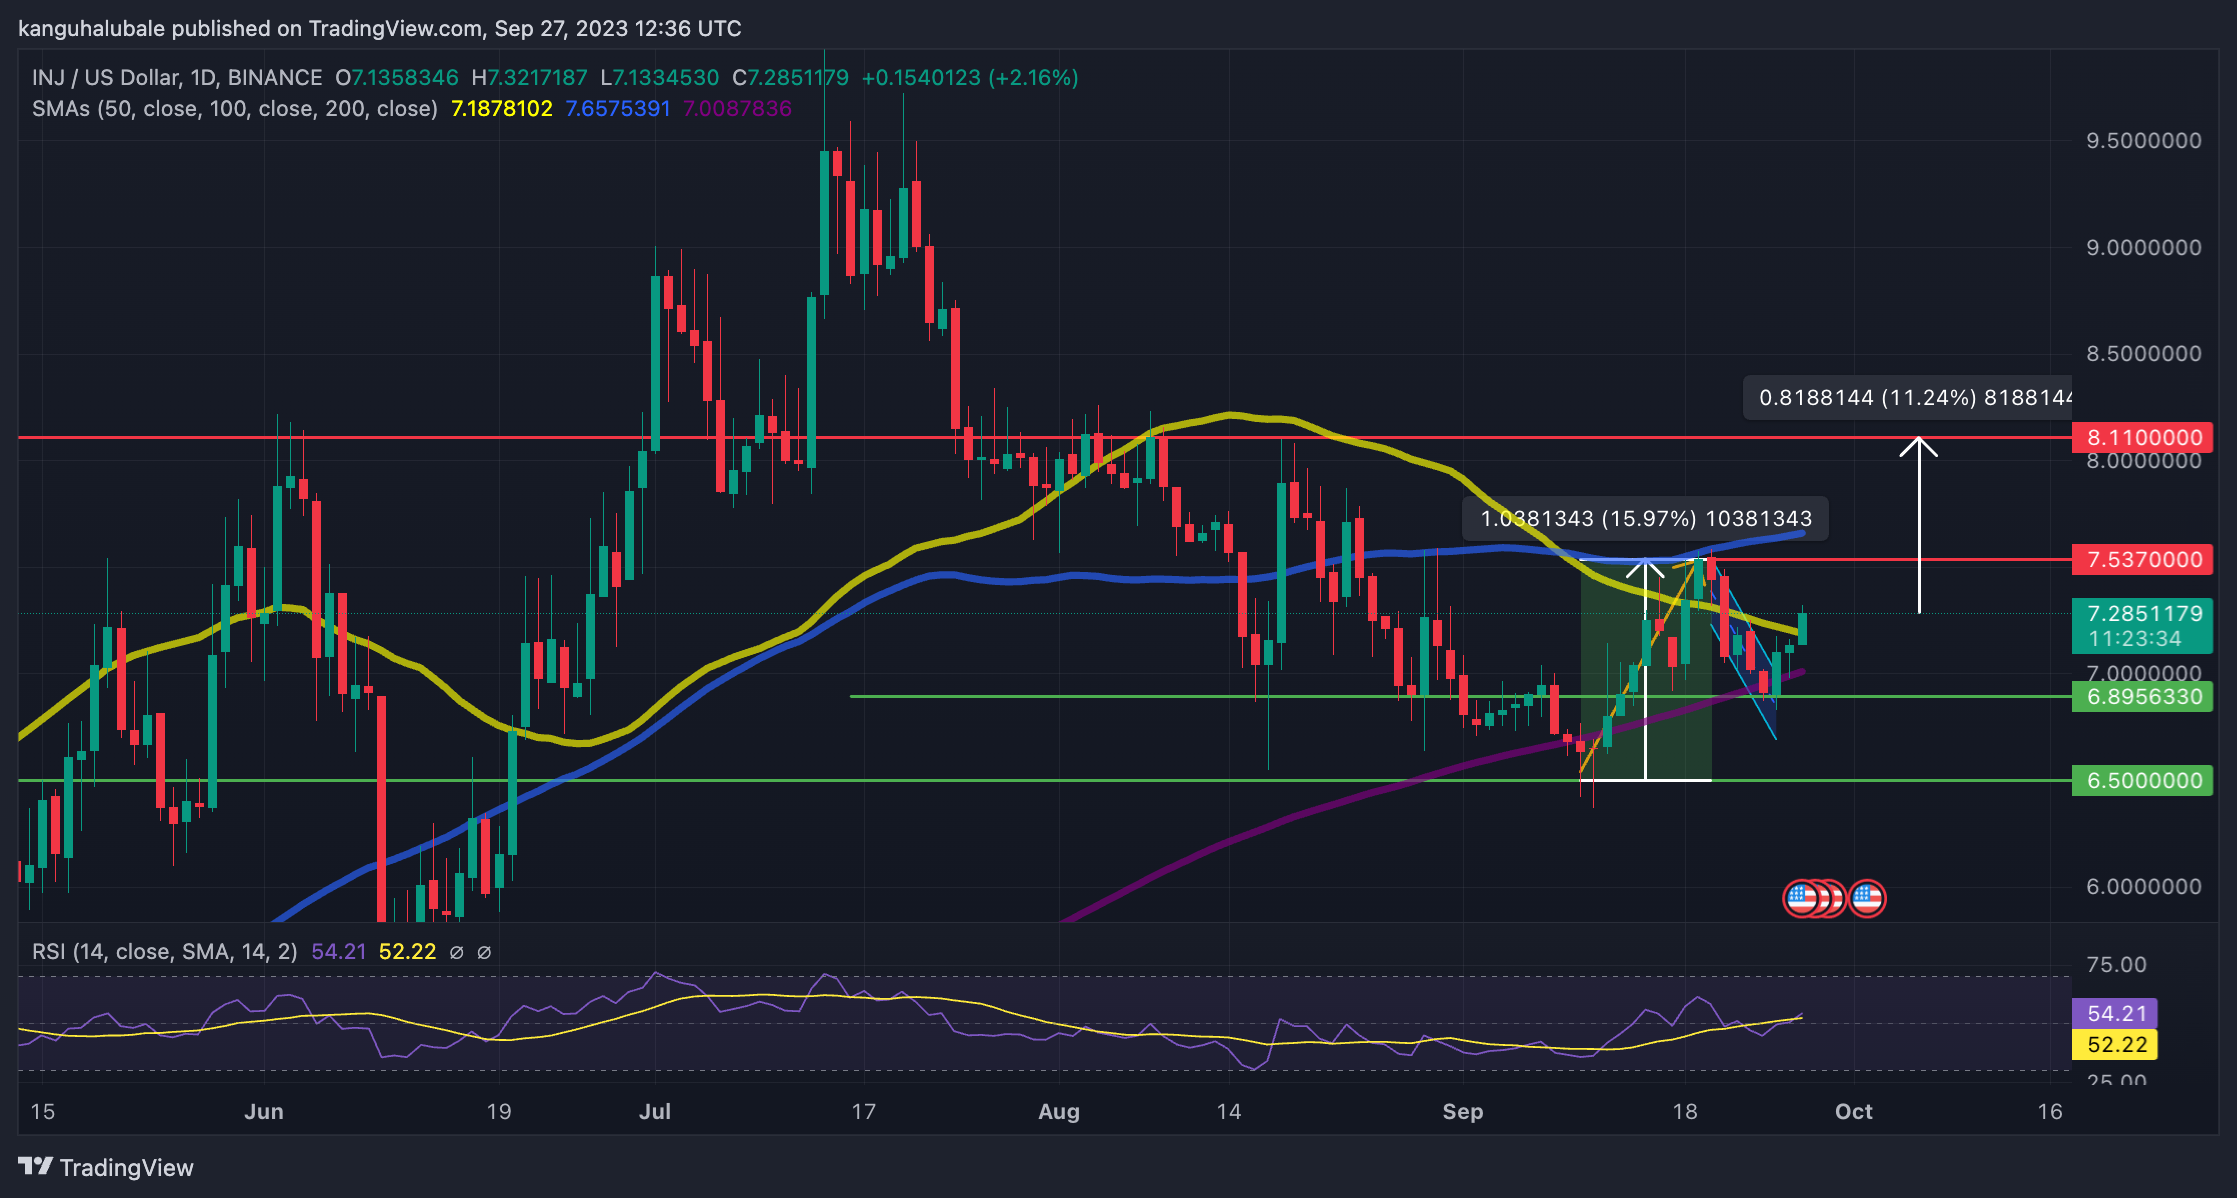
Besides this bullish chart formation, the position of the relative strength index (RSI) in the positive region added credence to Injective’s positive narrative. The price strength at 54 hinted at the entry of more buyers than sellers, who could push the price higher.
Moreover, the parabolic 50-day SMA and the 200-day SMA at $7.18 and $7.00 provided robust support on the downside. This favors the upside because they represent areas of demand that can produce the buying pressure required to push Injective higher.
Things could, however, go awry for the buyers if the price produces a daily candlestick close below the 50-day SMA. The next support lies at $7.0, embraced by the upper boundary of the flag and the 200-day SMA.
Breaching this level would take the price back into the flags, where it could continue moving for some time with 6.89 providing support. If this support is lost, the INJ price may take a free fall to the $ 6.5 support floor. Market participants could expect the price to take a breather before making another attempt at recovery.
Those seeking to buy Injective around the same levels should wait for the price to produce a decisive close above the 50-fay SMA. This would set investors on a path to get up to 11% gains if the price completes the technical pattern.
Investors could also look into new crypto projects in a presale to diversify their portfolios.
One token that can potentially make 20X gains in 2023 is Bitcoin Minetrix ($BTCMTX).
INJ Alternatives
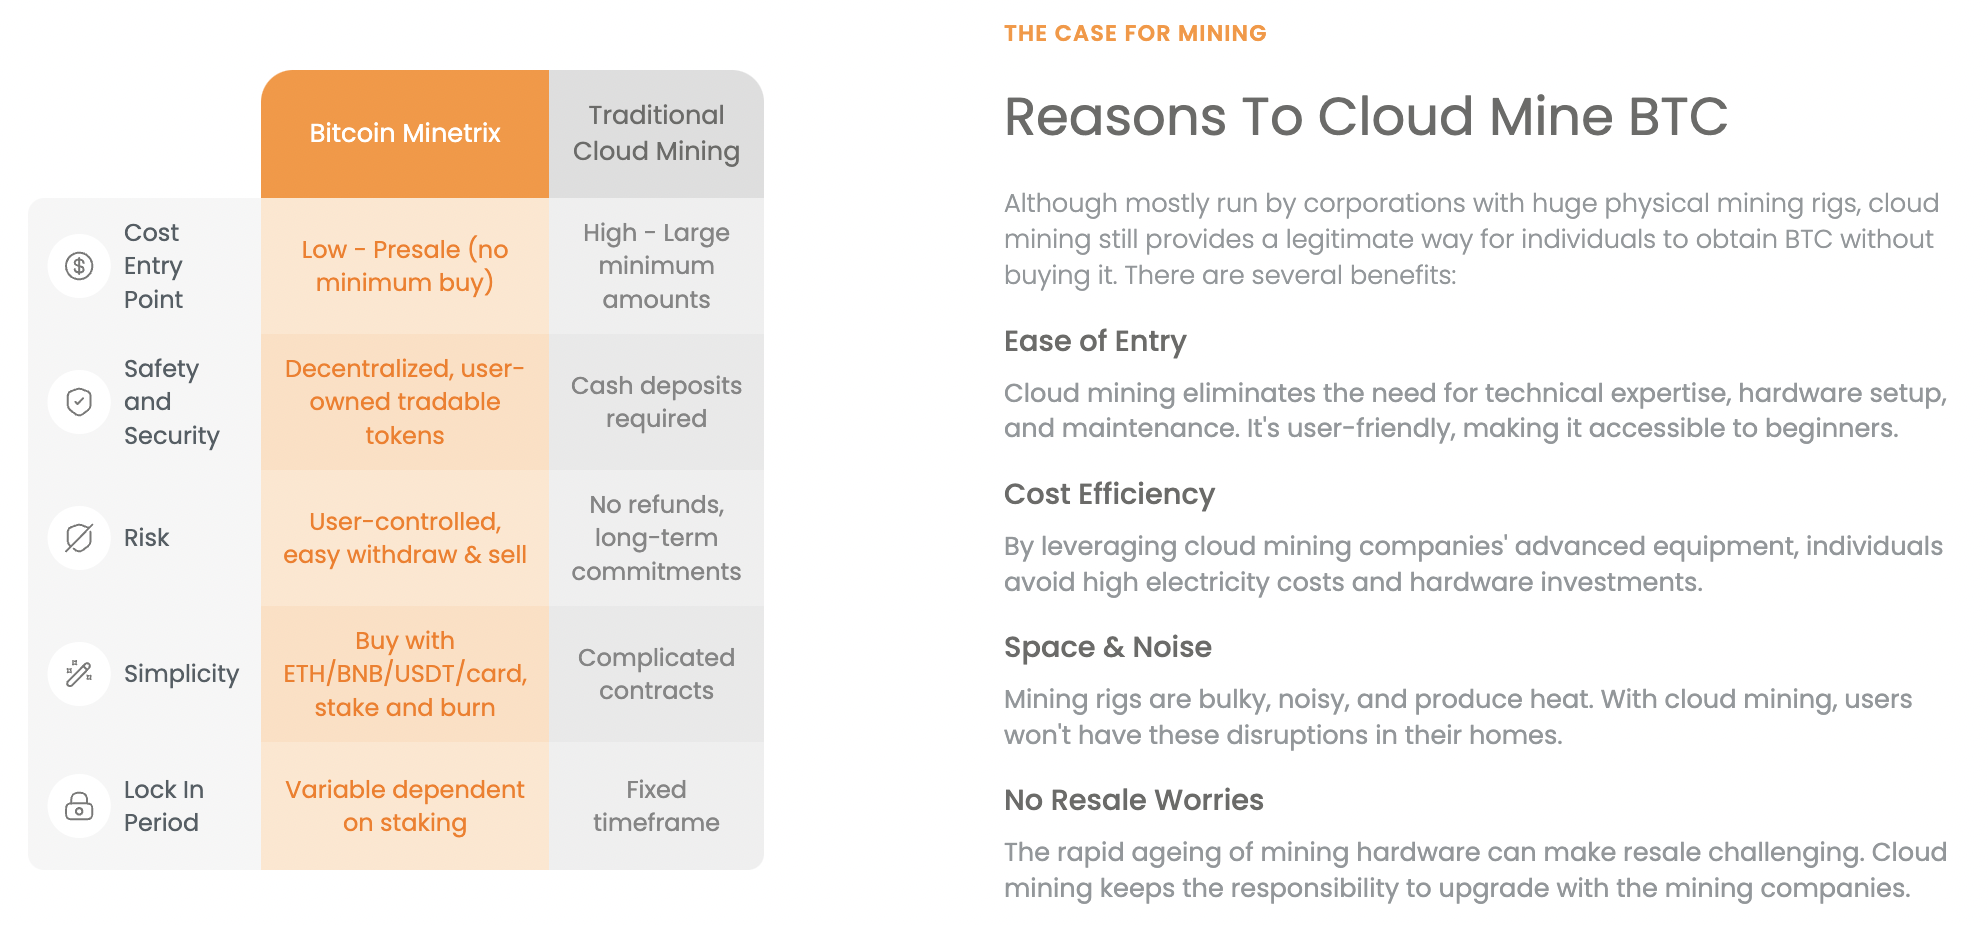
Bitcoin Minetrix ($BTCMTX) is catching the attention of investors as the first fully decentralized mining solution based on cloud computing, where stakers earn credits they can directly deploy to mine Bitcoin.
Traders are no doubt also intrigued by the implications of the stake-to-mine feature because of its potential to alleviate selling pressure at launch and incentivize long-term adoption.
https://x.com/bitcoinminetrix/status/1706583555831181539?s=20
Within hours of the presale opening, over $110,000 had been contributed to the soft cap initial fundraising goal of $15.6 million. At this rate, the presale could sell out its first stage, in which $3,080,000 is targeted, within a week.
https://youtu.be/HOtU4UfV_3Y?si=g4IirmbmBfcsGqG3
There are 10 stages to the presale – from Stage 2 onwards, the token price increases 10% at each stage. Therefore, there is no time to lose in locking in the lowest prices.
By combining the popular themes of ERC-20 token staking and Bitcoin mining, Bitcoin Minetrix has struck upon a rich seam with a pitch to market participants that is sure to appeal.
Visit Bitcoin Minetrix here to find out how to participate in this presale.
Related News
- Next Cryptocurrency To Explode 2023
- Next Cryptocurrency to Explode Wednesday, 27 September
- AI Crypto Projects
Join Our Telegram channel to stay up to date on breaking news coverage
