Join Our Telegram channel to stay up to date on breaking news coverage

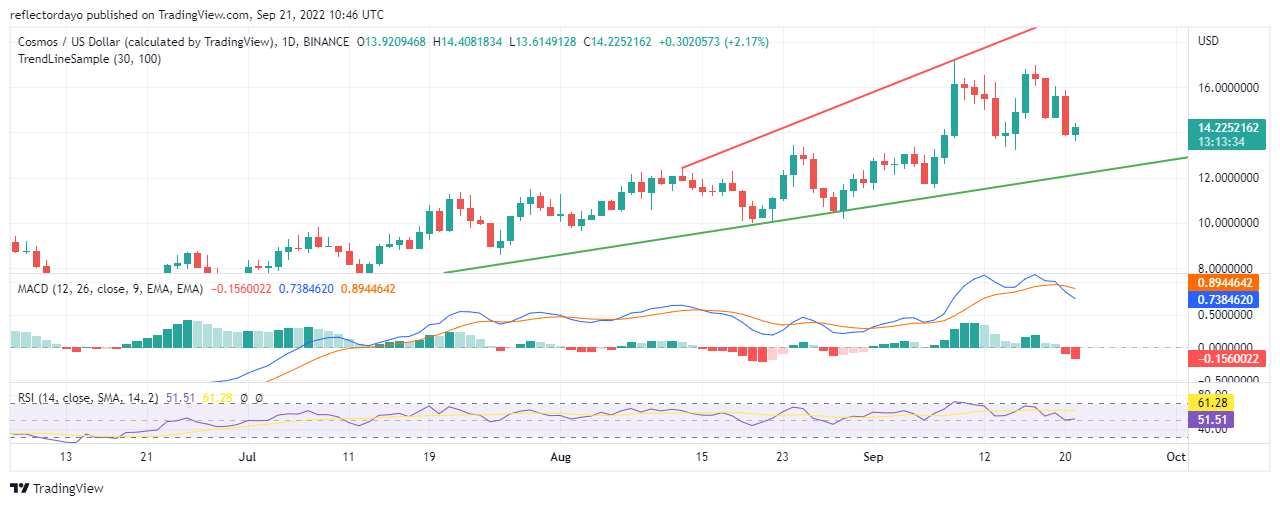
The general outlook of the ATOM/USD market is an uptrend. The price support levels are rising as the market progresses. Also, the price resistance levels are attaining new higher levels. Along the line, the sellers push the market with very strong momentum. But, they could not persist in pushing the market. Therefore, buyers are dragging them along.
Cosmos Market Price Statistic:
- ATOM/USD price now: $13.94
- ATOM/USD market cap: $3,992,881,704.57
- ATOM/USD circulating supply: 286,370,297
- ATOM/USD total supply: No Data
- ATOM/USD coin market ranking: #20
Key Levels
Resistance: $ 15.000, $15.500, $16.000
Support: $13.500, $13.000, $12.500
Your capital is at risk
Cosmos Market Price Analysis: The Indicators’ Point of View
In a general outlook, the Cosmos market is in an uptrend. The support and resistance trendline is moving in an ascending fashion, but lately, we see very bearish candlesticks on the chart. And this type of candlestick is making the two trend lines diverge (moving farther and farther) from each other.
It means the sellers are gathering momentum to push the market. In support of this observation, the MACD line has crossed the signal line and both lines are now changing direction to the lower levels. Also, the negative histograms show strong selling pressure. In the RSI, the line is moving at 52% while the signal line maintains 61%. RSI shows that buyer can still recover their ground.
Cosmos: ATOM/USD 4-Hour Chart Outlook
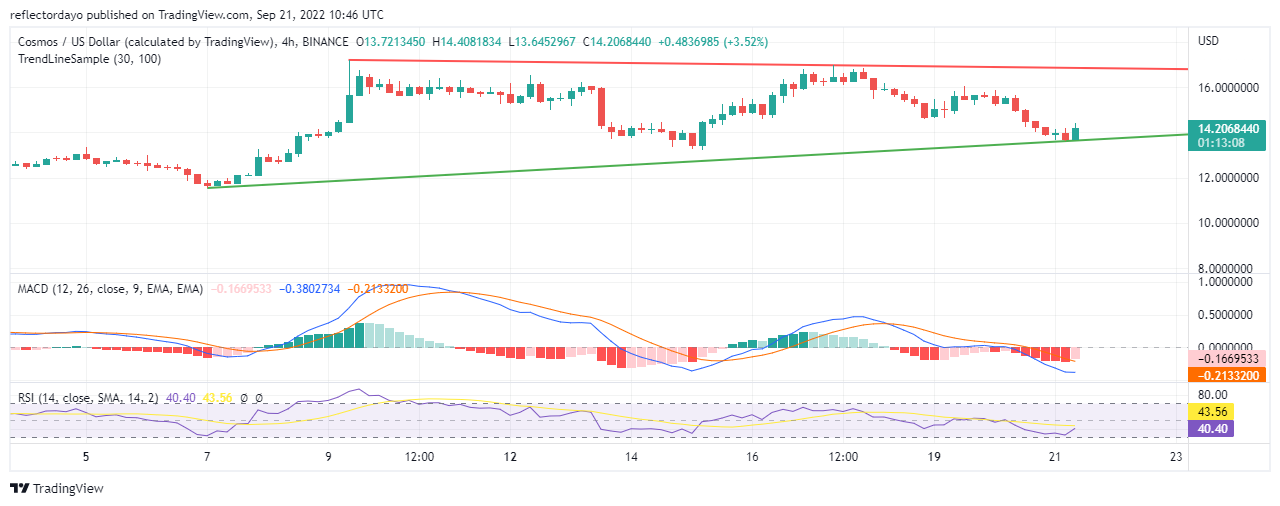
The Moving Average Convergence and Divergence of this timeframe show that the bearish momentum is waning already and giving way to a bullish market. But with the persistent bearish ‘comebacks’ the market may be preparing for a soon bearish reversal trend. The struggle is intense, but, for now, the bulls are having the upper hand.
Related
Join Our Telegram channel to stay up to date on breaking news coverage


