Join Our Telegram channel to stay up to date on breaking news coverage
Bitcoin (BTC) Price Prediction – May 8
The Bitcoin price briefly hit $10,000 yesterday and it’s testing that level again today.
BTC/USD Long-term Trend: Bullish (Daily Chart)
Key levels:
Resistance Levels: $11,500, $11,700, $11,900
Support Levels: $8,800, $8,600, $8,400
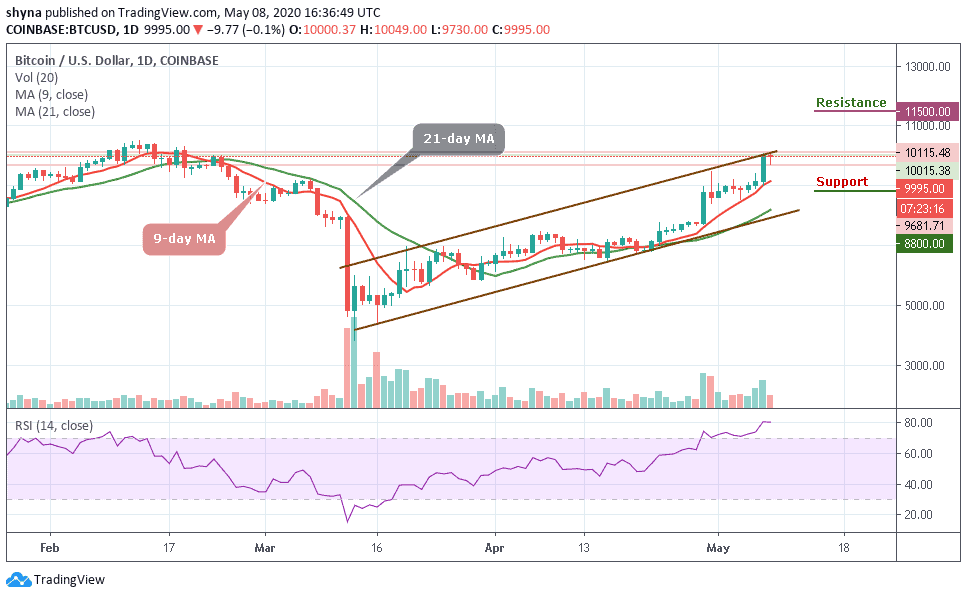
BTC/USD is currently wildly fluctuating around the $10,000 level as the bulls and bears are engaged in a furious tug of war. Looking at the daily chart, if the bulls do take control, but according to the technical indicator, they may not face any strong resistance levels all the way to $11,300 because the RSI (14) has gone up further in the overbought zone and is hovering around 80.93.
Yesterday, the Bitcoin price briefly hit $10,000 level, the highest it’s been since February this year before falling back down. At the opening of the market today, after testing the low of $9,681, the coin is currently trading at $9,995. Meanwhile, looking at the market movement, there is likely that the market may experience a quick retracement or sell-off just after touching the crucial $10,000, and traders may see $7,000 to $8,000 being tested again before pushing higher.
On the downside, if the market decides to fall, the price of Bitcoin could fall below the low of today around $9,681, and if that support fails to hold the sell-off, traders could see a further decline below the red-line of 9-day moving average and towards the support levels of $8,800, $8,600 and critically $8,400. All the same, any further bullish movement across the channel may hit the resistances at $11,500, $11,700, and $11,900.
BTC/USD Medium – Term Trend: Bullish (4H Chart)
BTC/USD is seen performing well on the 4-hour chart. With this, we expect the coin to gain the lost momentum and hit the trade above $10,000. However, the volatility hovers, and the selling pressure still exists which leads the coin not to be able to cross above the upper boundary of the channel. Meanwhile, the $9,500 and below may come into play if BTC breaks below $9,700 support level.
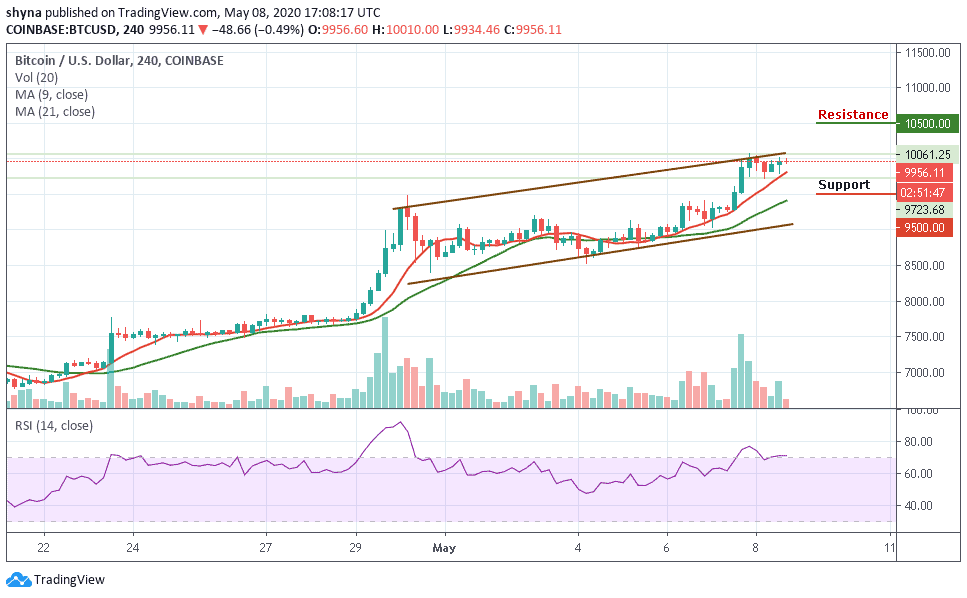
However, in as much as the buyers can still reinforce and power the market, traders can expect a retest at $10,000 resistance level, and breaking this level may further allow the bulls to reach $10,500 and above. The RSI (14) is seen trading above the 70-level which shows that more bullish signals may likely play out.
Please note: Insidebitcoins.com is not a financial advisor. Do your research before investing your funds in any financial asset or presented product or event. We are not responsible for your investing results.
Join Our Telegram channel to stay up to date on breaking news coverage