Join Our Telegram channel to stay up to date on breaking news coverage
Key Points
- Bitcoin price fell significantly and declined below the $5,000 and $4,600 supports against the US Dollar.
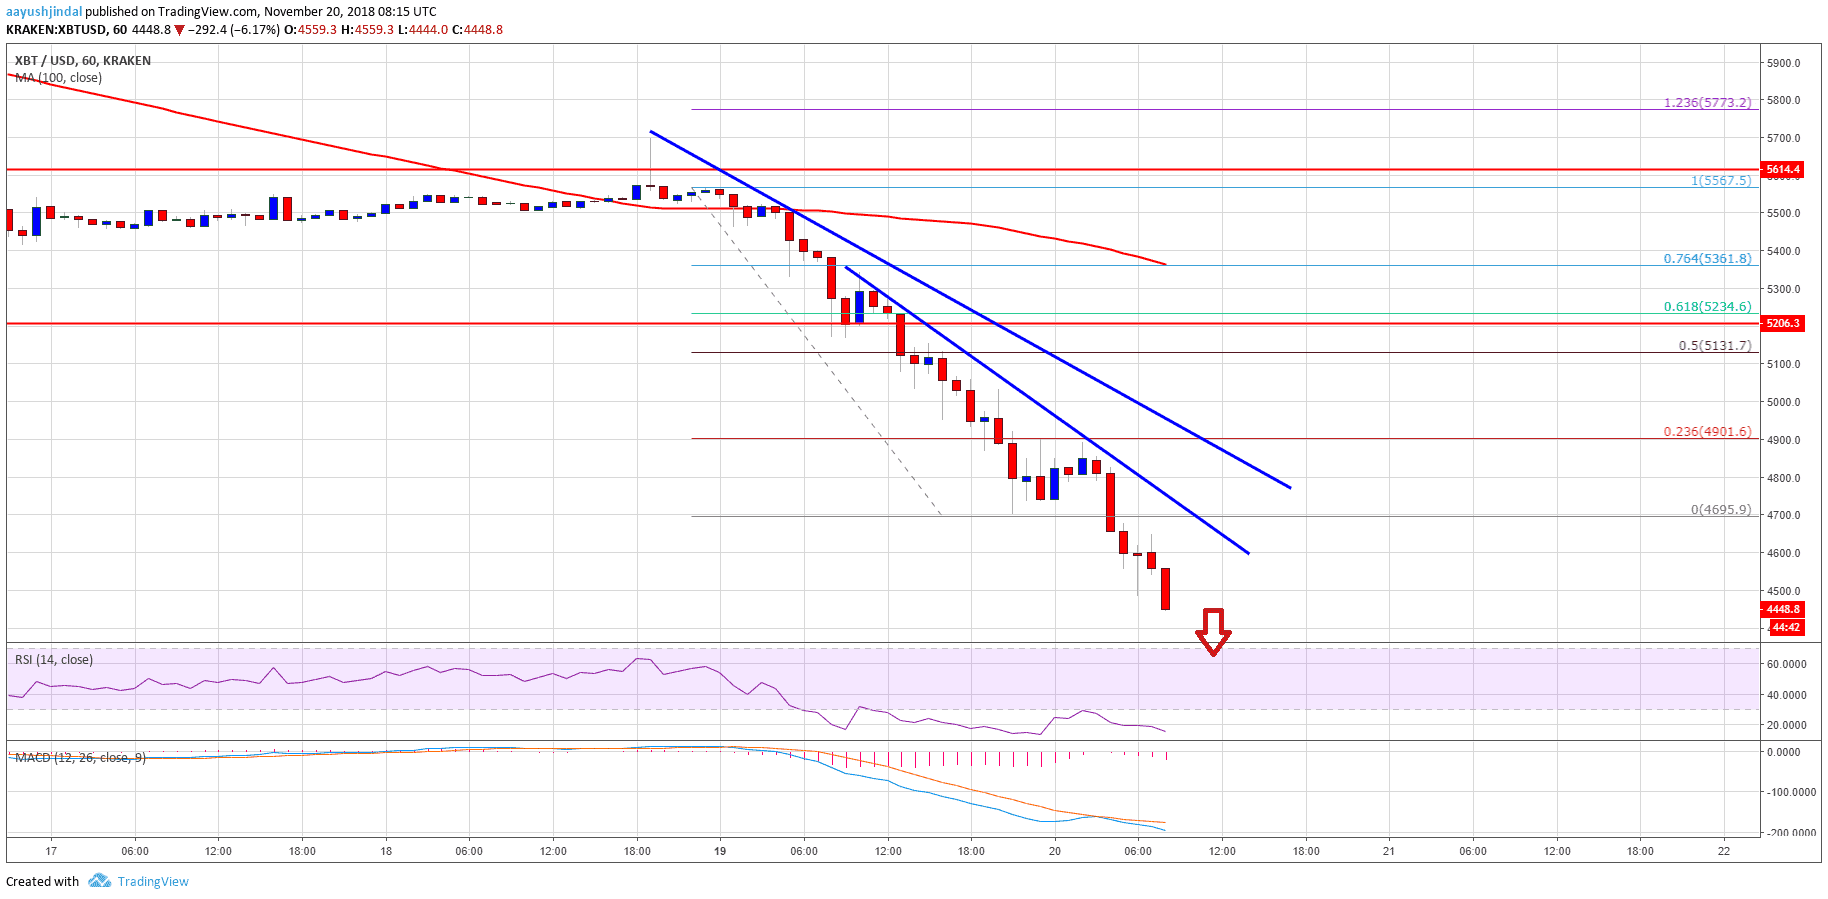
- There are two bearish trend lines formed with resistance near $4,800 on the hourly chart of the BTC/USD pair (data feed from Kraken).
- The price is likely to accelerate losses towards the $4,200 and $4,000 levels in the near term.
Bitcoin price traded to multi month low below $4,500 against the US Dollar. BTC/USD could continue to decline towards the $4,000 support area.
Bitcoin Price Analysis
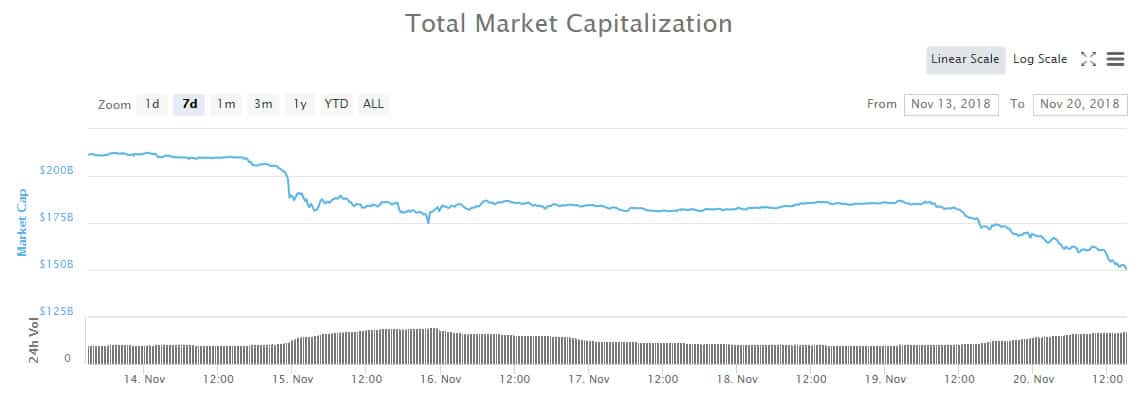
Yesterday, we discussed the chances of a new low below $5,200 in bitcoin price against the US Dollar. The BTC/USD pair did move down and broke the $5,200 and $5,000 support levels. The decline was such that the price fell more than 12% and broke the $4,600 support as well. Ethereum price also declined heavily below the $150 level, igniting bearish moves in the crypto market. However, ripple price remained stable and traded above $0.4800.
Recently, BTC formed a swing low at $4,695 and corrected higher. It moved above the $4,800 level, but upsides were limited. The price failed to climb above the 23.6% Fib retracement level of the last decline from the $5,567 high to $4,695 low. As a result, there was a fresh decline and the price declined below the $4,695 low. Sellers took control and pushed the price below the $4,500 support. Going forward, the price is likely to accelerate losses towards the $4,200 and $4,000 levels. On the upside, there are two bearish trend lines formed with resistance near $4,800 on the hourly chart of the BTC/USD pair.
Looking at the chart, bitcoin price is clearly under heavy selling pressure below $5,000. Any short term correction could face a lot of selling interest near $4,800 or $5,000.
Looking at the technical indicators:
Hourly MACD – The MACD for BTC/USD is gaining momentum in the bearish zone.
Hourly RSI (Relative Strength Index) – The RSI is currently well below the 20 level.
Major Support Level – $4,200
Major Resistance Level – $5,000
The post Bitcoin Price Watch: BTC/USD Nosedives 15%, $4,000 Next? appeared first on NewsBTC.
Join Our Telegram channel to stay up to date on breaking news coverage


