Join Our Telegram channel to stay up to date on breaking news coverage
ETH/USD is down five percent in the last week and the result is obvious. Prices are now trading below the psychological support of $200 further driving miners into loss making territory. Though we remain optimistic and expect prices to steady, dips below Sep lows could trigger the next wave of sell pressure pressing back ETH/USD towards $150.
Latest Ethereum News
Dropping and flat lining prices is not good business from miners. And it doesn’t matter the coin. The proprietors behind mining are business people keen on scalping the crypto market, liquidating their ETH rewards for money at several exchanges. Though it appears that mining activity in other coins as Litecoin is picking up with hashing rates expanding 750 percent on a yearly basis, ETH miners are facing a stumbling block.
In the path towards Serenity there is a mandatory implementation of Constantinople, a hard fork or an “upgrade” where the network must enforce EIP 1011 Hybrid Casper FFG draft. This will see ETH rewards drop from 3 to 2 per block generation which at the face of strong sell pressure and talks of further sells is simply damping for mining as an industry. In fact it didn’t take long before the side effect leaked.
A recent analysis from LongHash shows that Ethereum network is losing computing power as miners react to recent proposals. Hash power is down 12 percent from August and while miners are majority owners of ETH stash, this could reduce ETH in circulation. Consequently, this could create an artificial demand which many hope will lift the USD valuation of ETH. That’s assuming prices remain at spot levels.
Should it drop then miners would be knee deep in loss making territory at prevailing cost of electricity, mining gear, transport and pool membership.
Ethereum (ETH/USD) Price Analysis
Weekly Chart
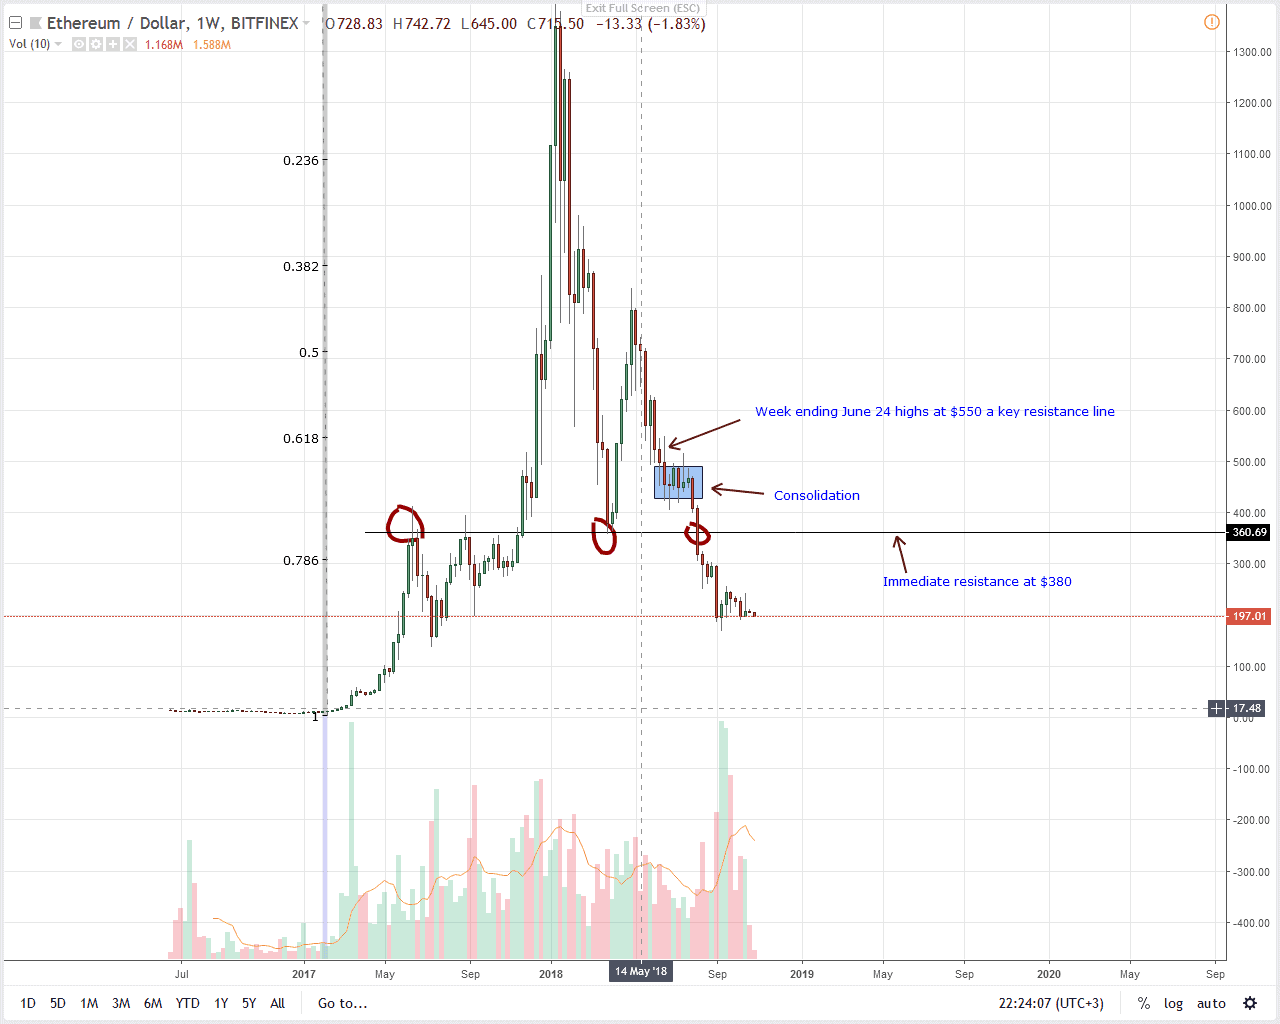
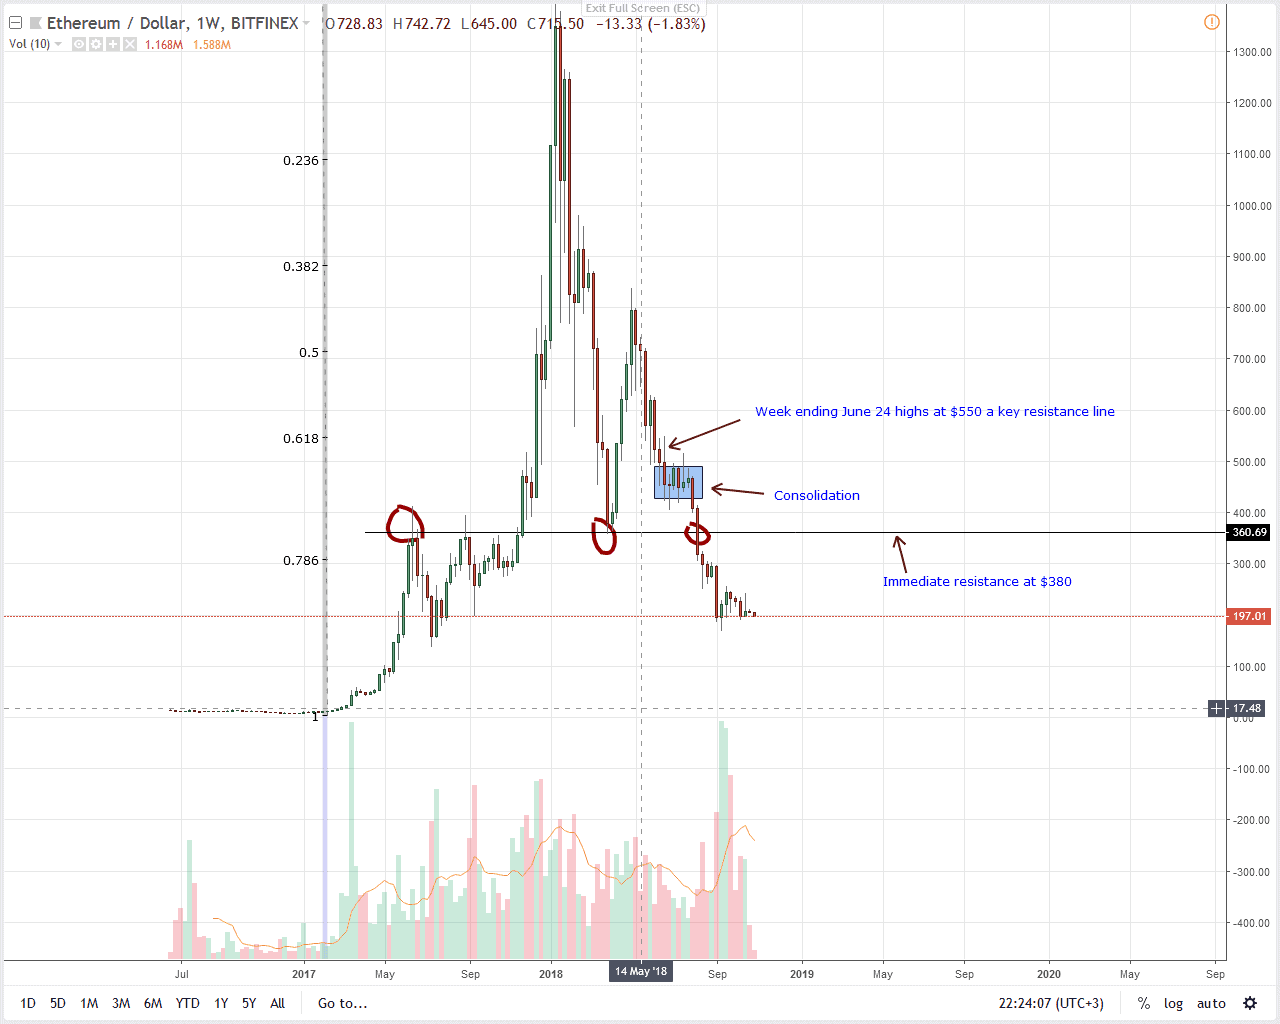
The meltdown is on and ETH/USD is down five percent in the last week. From the chart it is clear that sellers are stepping up and trading in line with events of week ending Sep 9. All things constant, yesterday’s drop and breach of $200 main support line will most likely lead to drops below $190 or Sep lows triggering another wave of sell pressure towards $150 and $75.
This is all laid out in our previous ETH/USD price analysis where our strategy was to maintain a neutral stand until after there are clear drops below Sep lows or rallies above $250-$300 resistance zone. Since the former is happening, we suggest zooming out to lower time frames and waiting for a whole sell bar to close below Sep 2018 lows before loading shorts on pull backs.
Daily Chart
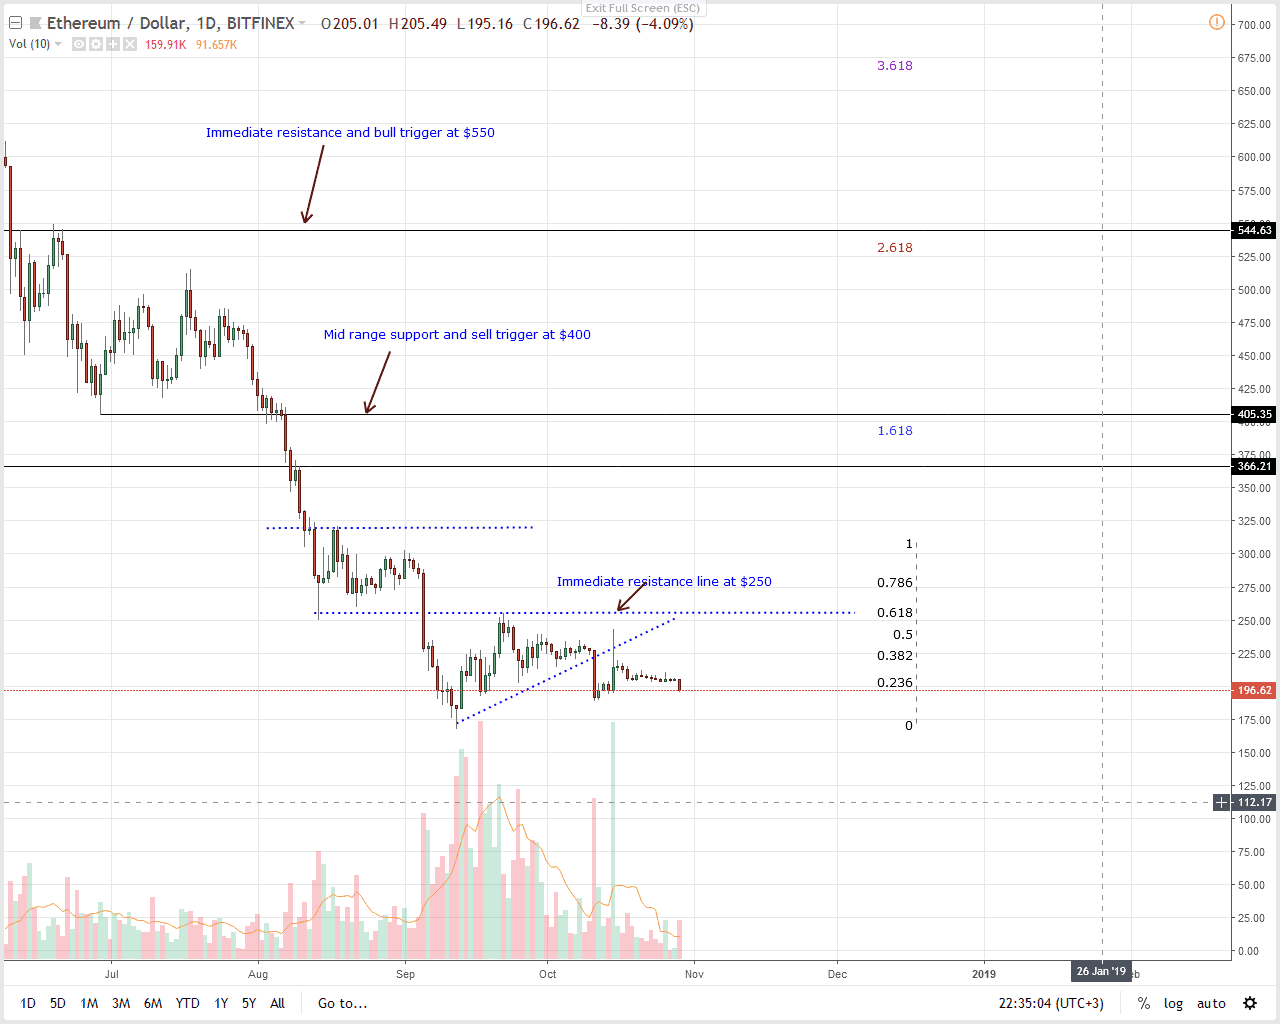
After two weeks of consolidation inside Oct 15 high low, ETH/USD volatility is back and what we have now is a bearish break out. Well, this was unexpected considering the deep price correction of 2018 and today should be definitive.
As set out from a top down approach, any solid close below Oct 11 lows at $190 will ignite the next wave of sell pressure with first targets at $150 or lower. But, because of the spike in volumes—jump from 48k on Oct 28 to 150k on Oct 29, we suggest sells at spot prices. Therefore, considering candlestick layout, ideal stops for aggressive traders is at $210 as targets remain as they are.
Disclaimer: Views and opinions expressed are those of the author and aren’t investment advice. Trading of any form involves risk and so do your due diligence before making a trading decision.
The post ETH/USD Price Analysis: Ethereum Bulls Crash as Market Lose $1 Billion appeared first on NewsBTC.
Join Our Telegram channel to stay up to date on breaking news coverage
