Join Our Telegram channel to stay up to date on breaking news coverage
XRP Price Prediction – May 1
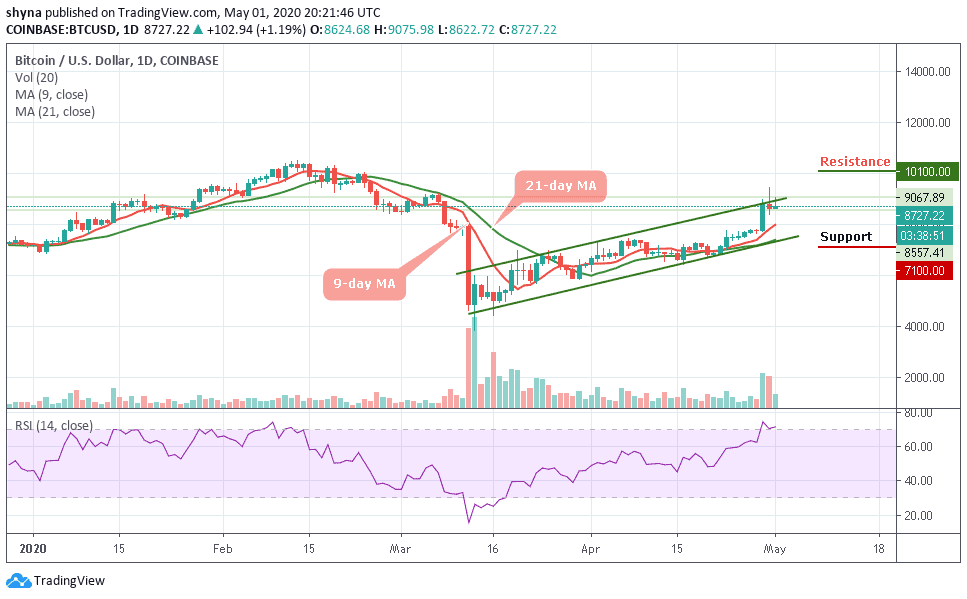
The Ripple price is trading in the positive territory, with gains of some 2.36%.
XRP/USD Market
Key Levels:
Resistance levels: $0.26, $0.27, $0.28
Support levels: $0.17, $0.16, $0.15
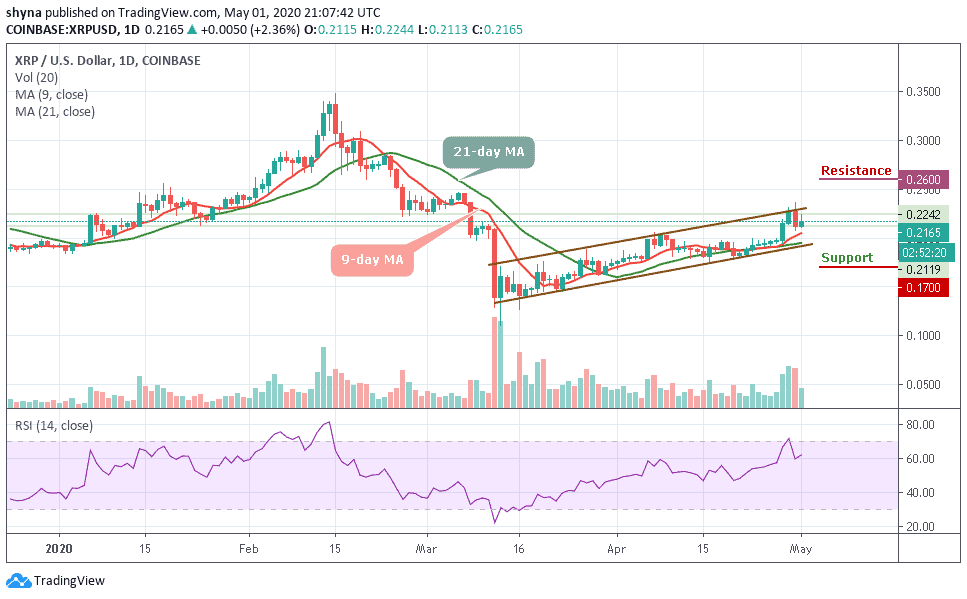
XRP/USD moved from $0.211 in a matter of hours and touched an intraday high at $0.224. While the coin has retreated to $0.216 at the time of writing, the pair retains bullish momentum. In the short term, XRP/USD has gained more than 2.36% within 24 hours. Meanwhile, the bulls needed a daily break and closure above $0.220 to invite greater momentum of people that buy Ripple.
At the moment, the price of the coin is changing hands at $0.216 level and the bulls are still pushing the price towards the north. In other words, if the price moves below the 9-day and 21-day moving averages and breaks down the lower boundary of the channel; the price could be pushed to the support levels of $0.17, $0.16, and $0.15.
Moreover, the technical indicator RSI (14) is moving above the 60-level which confirms the bullish trend that may take the coin to the nearest resistance level of $0.24, further resistance could be found at $0.26, $0.27 and $0.28 levels before the market is free to make another attempt at $0.30 level.
When compared with Bitcoin, the pair is consolidating within the channel and moving below the 9-day and 21-day moving averages. Meanwhile, the buyers are still making an effort to push the price above the moving averages within the channel and the bullish continuation may take it to the resistance levels of 2700 SAT and 2800 SAT respectively.
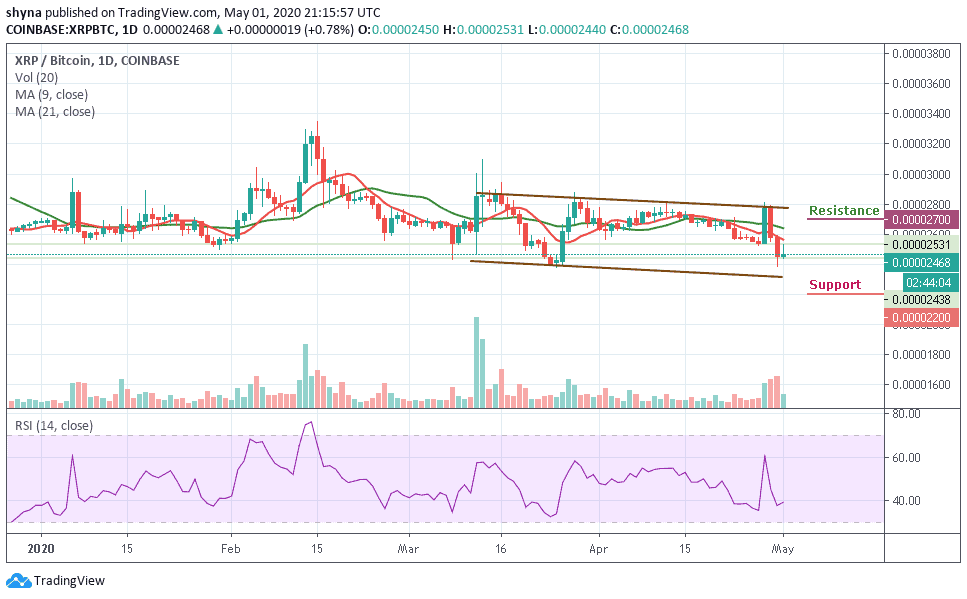
Meanwhile, any bearish movement may likely push the market towards the south and a possible fall could drag the market to the support levels of 2200 SAT and 2100 SAT. According to the RSI (14), the signal line is moving around 40-level, which may likely give bullish signals.
Please note: Insidebitcoins.com is not a financial advisor. Do your research before investing your funds in any financial asset or presented product or event. We are not responsible for your investing results.
Join Our Telegram channel to stay up to date on breaking news coverage