Join Our Telegram channel to stay up to date on breaking news coverage
Terra Classic (LUNC) Price Prediction – October 12
Active trading activities in the LUNC/USD market operation have lessened to a notable lower-trading spot as the crypto tends to rebuild a baseline soon around a high-psychological trading spot. Price has been bargaining between the $0.00030010 and $0.0002667 value lines representing high and ,low points in the last hours of today’s ongoing sessions at a 3.24%.
LUNC Price Statistics:
LUNC price now – $0.0002861
LUNC market cap – $1.8 billion
LUNC circulating supply – 6.2 trillion
LUNC total supply – 6.9 trillion
Coinmarketcap ranking – #32
LUNC/USD Market
Key Levels:
Resistance levels: $0.00035, $0.0004, $0.00045
Support levels: $0.00025, $0.0002, $0.00015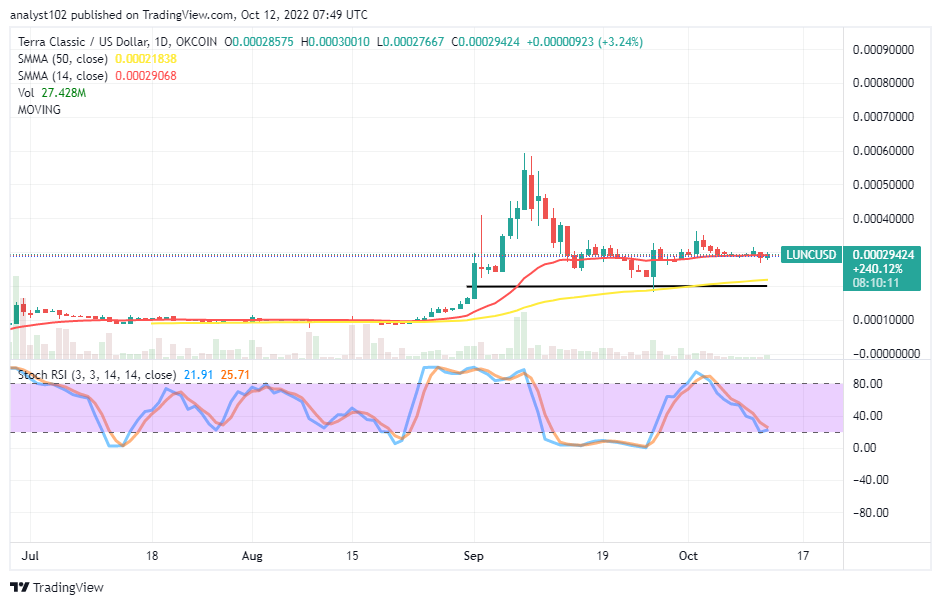
The LUNC/USD long-term chart features the crypto economy may rebuild a baseline soon around the trend line of the smaller SMA. The 50-day SMA indicator is at $0.00021838 value point, underneath the 14-day SMA indicator, which is at $0.00029068 point. The horizontal line is drawn around the bigger SMA to make support for it. The Stochastic Oscillators have traveled southbound to average the range of 20, maintaining 25.71 and 21.91 range values.
Your capital is at risk
Will the LUNC/USD trading pair maintain establishing a baseline around the smaller SMA trend line?
Expectations are high that the LUNC/USD trading pair will maintain establishing a baseline around the smaller trend line as the crypto market possesses the tendency to rebuild soon. The trading situation may still witness a chain of lower lows closely below the trend line of the 14-day SMA to allow the price to regain support at a lower-trading zone. Therefore, buyers can patiently wait for a resurface of price swinging up from a lowering spot before joining the trend back to the upside.
On the downside of the technical analysis, sellers currently seem not to be held firmly in the aftermath down-trending motion as it is close to letting the market resurface with an upswing even though a downward motion occurs at any moment. In its simplest form, shorting of positions now needs to be put on hold for a bit. Long-term investors can add more to their portfolios even if the price attempts to downsize.
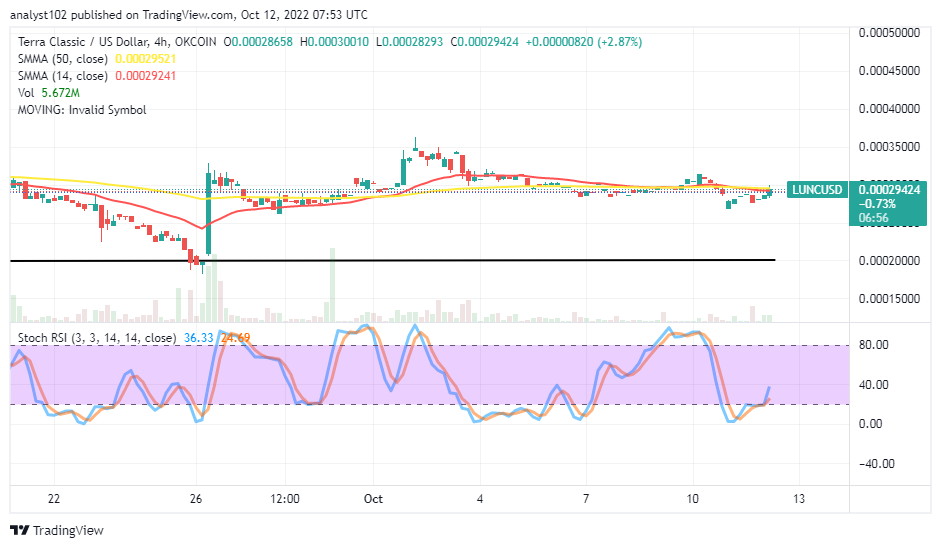
LUNC/USD Medium Chart
The LUNC/USD medium-term chart showcases the crypto worth against the US Dollar and may rebuild a baseline soon closely from underneath the SMA trend lines. The 14-day SMA indicator is at $0.00029241, underneath the $0.00029521 point of the 50-day SMA indicator. And they are around the $0.00030 trading zone. The Stochastic Oscillators are in the oversold region, trying to cross back northbound as they keep 24.69 and 36.33 range values. That gives an insight that the crypto business tends to flourish soon against the US Dollar in no time.
Read more:
Join Our Telegram channel to stay up to date on breaking news coverage
