
Join Our Telegram channel to stay up to date on breaking news coverage
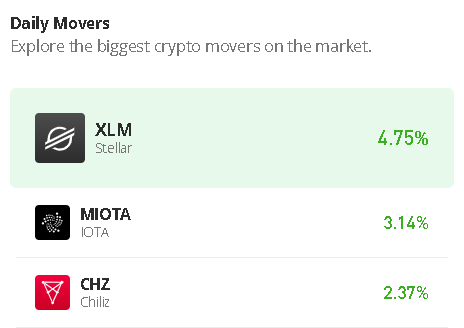
The Stellar price prediction shows that XLM restarts the uptrend after crossing above the critical barrier of $0.115 to touch the daily high of $0.122.
Stellar (XLM) Prediction Statistics Data:
- XLM price now – $0.120
- XLM market cap – $3 billion
- XLM circulating supply – 25.4 billion
- XLM total supply – 50 billion
- XLM Coinmarketcap ranking – #25
XLM/USD Market
Key levels:
Resistance Levels: $0.140, $0.145, $0.150
Support Levels: $0.100, $0.095 $0.090
Your capital is at risk
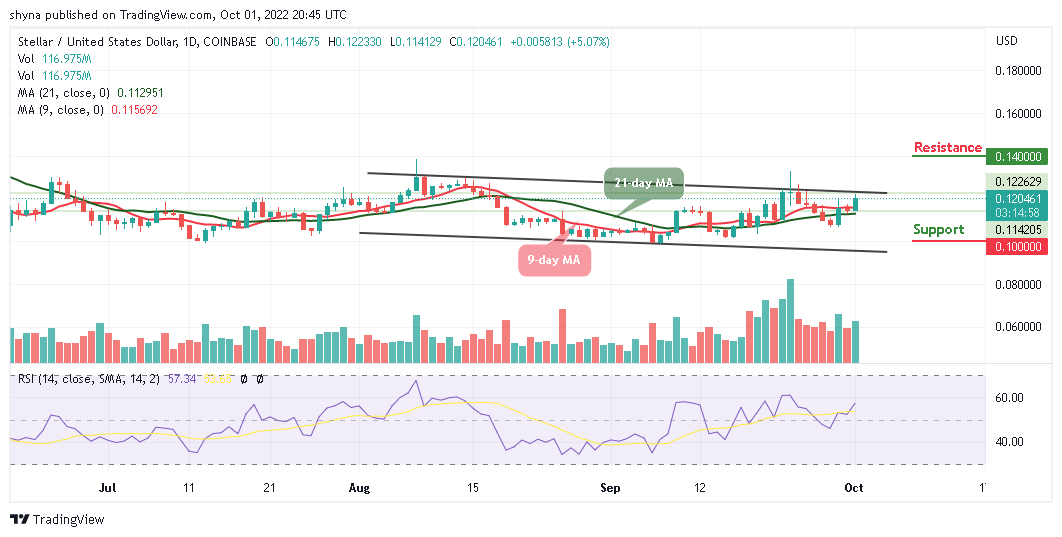
XLM/USD looks green today as the price hovers above the resistance level of $0.115 from the opening price of $0.114. A daily close above the $0.122 level may increase the Stellar price to $0.130. At the moment, all eyes are on the next hurdle that the coin will follow.
Stellar Price Prediction: Price May Break Higher
At the time of writing, the Stellar price is moving marginally at its current price of $0.120 with another tremendous bullish movement today. According to the daily chart, this marks a meaningful climb from the opening price of $0.114 level; therefore, it is important to note that the current movement marks a bull-favoring break above the 9-day and 21-day moving averages and could as well climb above the upper boundary of the channel.
Nevertheless, if the market price slides below the moving averages, the Stellar price could face the lower boundary of the channel, and before getting to this barrier, traders could see a serious decline towards the support levels of $0.100, $0.095, and $0.090 respectively. Meanwhile, any further bullish movement above the channel could touch the resistance level at $0.140, $0.145, and $0.150 as the Relative Strength Index (14) moves to cross above the 60-level, suggesting more bullish signals in the market.
Against Bitcoin, the Stellar price is hovering above the 9-day and 21-day moving averages. However, intraday trading is still looking bullish as a cross above the upper boundary of the channel could hit the resistance level at 700 SAT and above.
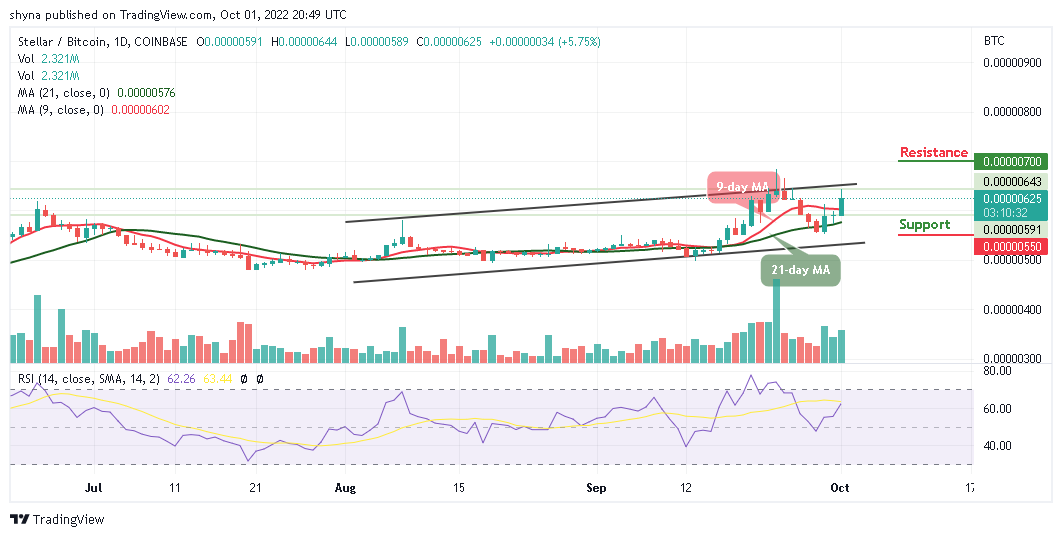
On the contrary, if the buyers failed to keep pushing the market upward, traders can expect a retreat below the 21-day moving average, and breaking this barrier may cause the market price to reach the support level of 550 SAT and below. Meanwhile, the Relative Strength Index (14) is seen crossing above the 60-level, suggesting bullish signals.
Join Our Telegram channel to stay up to date on breaking news coverage