Join Our Telegram channel to stay up to date on breaking news coverage
Ripple Price Prediction – January 14
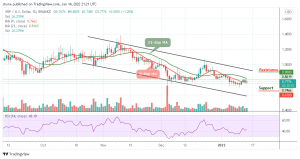
The Ripple price prediction shows that XRP is floating within the channel as the price has been trying to break to the upside.
XRP/USD Market
Key Levels:
Resistance levels: $0.90, $095, $1.00
Support levels: $0.65, $0.60, $0.55

A few days ago, XRP/USD had a bullish breakout from a flag formation as it looks to consolidate its position below the 9-day moving average. At the time of writing, the coin is floating within the moving averages as the technical indicator Relative Strength Index (14) moves above 40-level. The daily breakdown shows that the intraday support and resistance lie between $0.16 and $0.18 respectively.
Ripple Price Prediction: Ripple (XRP) May Move Sideways
At the time of writing, the Ripple price is likely to demonstrate a sign of weakness across its markets as the red-line of the 9-day moving average remains below the green-line of the 21-day moving average. The daily chart reveals that the coin is slightly up with 1.20% which is reflecting a small rise in market prices, but the fall could become heavy if the bearish action continues.
Therefore, since XRP/USD is moving in sideways on short-term outlook, traders can expect the trend to advance higher if the price actions remain above the 9-day and moving average. A break above the 21-day moving average could strengthen bulls and push the price to the resistance levels of $0.90, $0.95 and $1.00 or a breakdown below the 9-day moving average might lead the market in a bearish scenario if the price continues to fade and could locate the closest supports at $0.65, $0.60, and critically $0.55.
When compares with Bitcoin, the trend of the coin is still ranging in the short-term, hovering at 1798 SAT. Meanwhile, the bears may take the price to the support level of 1700 SAT and below. However, if the bulls push the price towards the north, traders may expect the price to rise above the 9-day and 21-day moving averages.
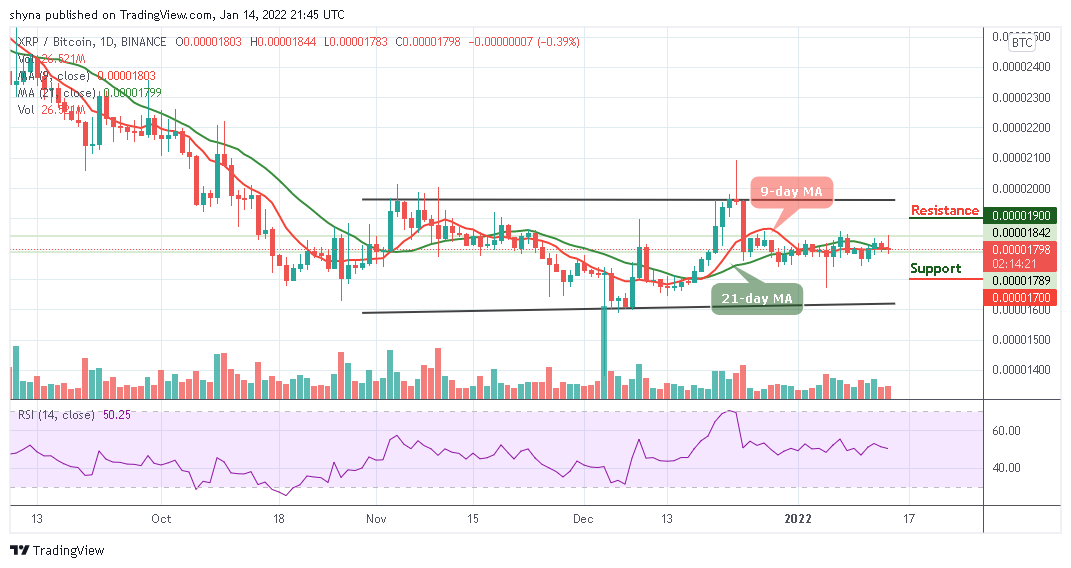
For now, the nearest resistance level for the market is around 1900 SAT and above. Looking at the chart, there’s a sign of indecisive movement now but the XRP/BTC is likely to decline below the moving averages as the Relative Strength Index (14) may cross below 50-level.
Looking to buy or trade Ripple (XRP) now? Invest at eToro!
68% of retail investor accounts lose money when trading CFDs with this provider
Join Our Telegram channel to stay up to date on breaking news coverage