Join Our Telegram channel to stay up to date on breaking news coverage
SushiSwap Price Prediction – October 14
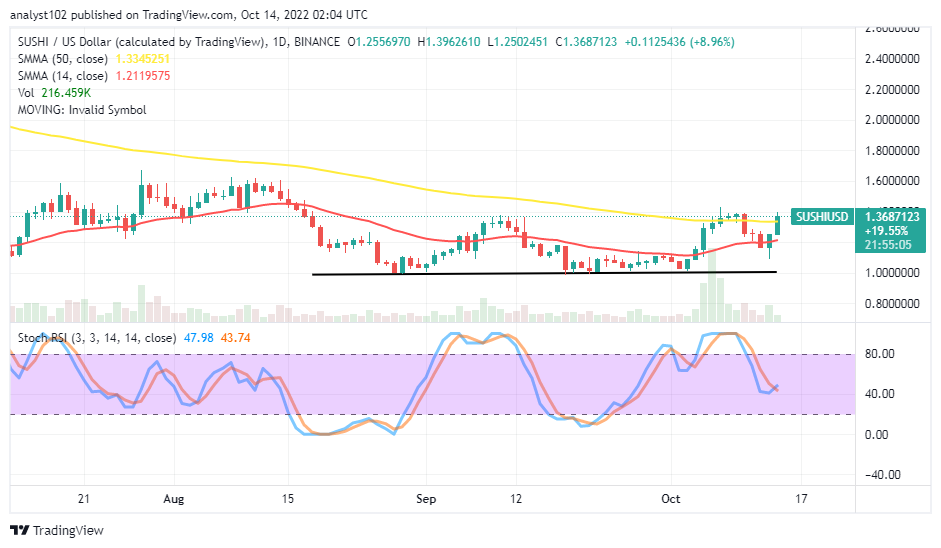
Indications are holding an attestation that the SUSHI/USD market might make a strong push against the $1.40 logical high-trading zone that has emerged harder against variant upswings in the past sessions. The financial book of records shows an all-time low on November 4, 2020, at $0.4737, and an all-time high of $23.38 since March 13, 2021.
SUSHI Price Statistics:
SUSHI price now – $1.35
SUSHI market cap – $171.4
SUSHI circulating supply – 127.2 million
SUSHI total supply – 244.5 million
Coinmarketcap ranking – #143
SUSHI/USD Market
Key Levels:
Resistance levels: $1.60, $1.70, $1.80
Support levels: $1.10, $1, $0.90
The daily chart showcases the SUSHI/USD market might make a strong push past the $1.40 psychological high-trading level in the near following sessions. The 50-day SMA indicator is at the $1.34 value line, over the trending point of the 14-day SMA indicator, which is at the $1.21 level. The Stochastic Oscillators have traveled southbound closely above the range of 40. And they are attempting to cross back northbound at 45.74 and 47.98 range values.
Your capital is at risk
Will there be a breakout at the $1.40 trading zone of the SUSHI/USD market soon?
There have been indications for two days that suggest the SUSHI/USD market might make a strong push against the $1.40 logical level. Buyers can rely on the positive energies currently emerging from the candlestick and extending northward. A fearful reversal motion tempting to decimate today’s candlestick against the trend value of the smaller SMA will pose a danger to the presence of bulls’ positions.
On the downside of the technical analysis, it would be a technical trading idea to play cautiously around the $1.40 level, as there can be an early correction move that can allow bears to reluctantly take advantage of because of the bullish length of the current trading candlestick. Sellers need to wait for a condition that denotes an overbought reading condition on the market by the Stochastic Oscillators before considering a shorting order afterward.
SUSHI/BTC Price Analysis
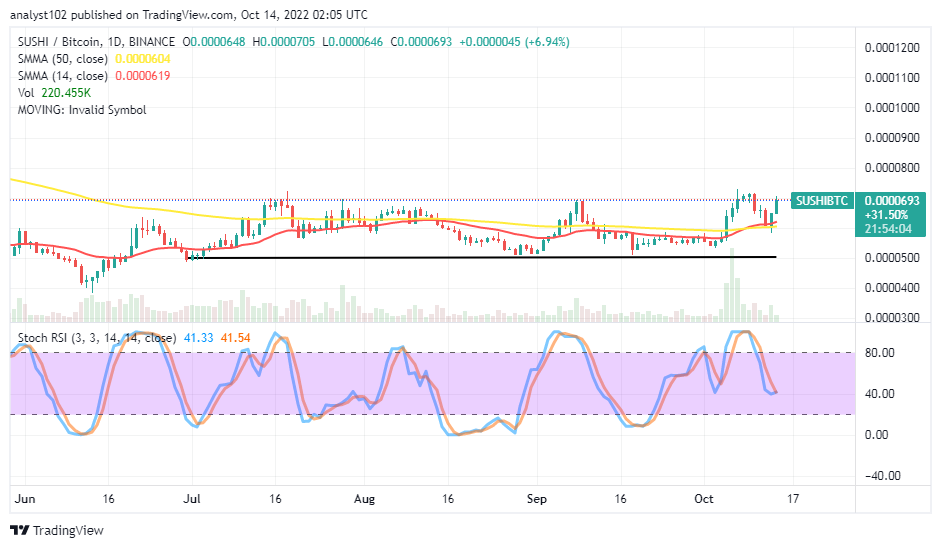
SushiSwap’s trending ability has continued for a couple of sessions around a high-trading spot. The pairing crypto might make a strong push through variant resistance points above the trend lines of the S<As. The 14-day SMA indicator has joined the 50-day SMA indicator, stretching eastward to indicate a relative sideways motion in the duo cryptos. The Stochastic Oscillators have moved southward close over the range of 40, trying to close their lines at 41.54 and 41.33 range points. The present occurrence of a bullish candlestick denotes the Oscillators tool is lagging to some reasonable extent. Therefore, if today’s end of operation doesn’t witness a decimation of values, the base crypto may continue to surge higher.
Read more:
Join Our Telegram channel to stay up to date on breaking news coverage


