

Join Our Telegram channel to stay up to date on breaking news coverage
ETH Price Prediction – October 21
The Ethereum bullish case to $400 now depends on the bulls’ effort to defend $370 initial support in the near term.
ETH/USD Market
Key Levels:
Resistance levels: $425, $435, $445
Support levels: $325, $315, $305
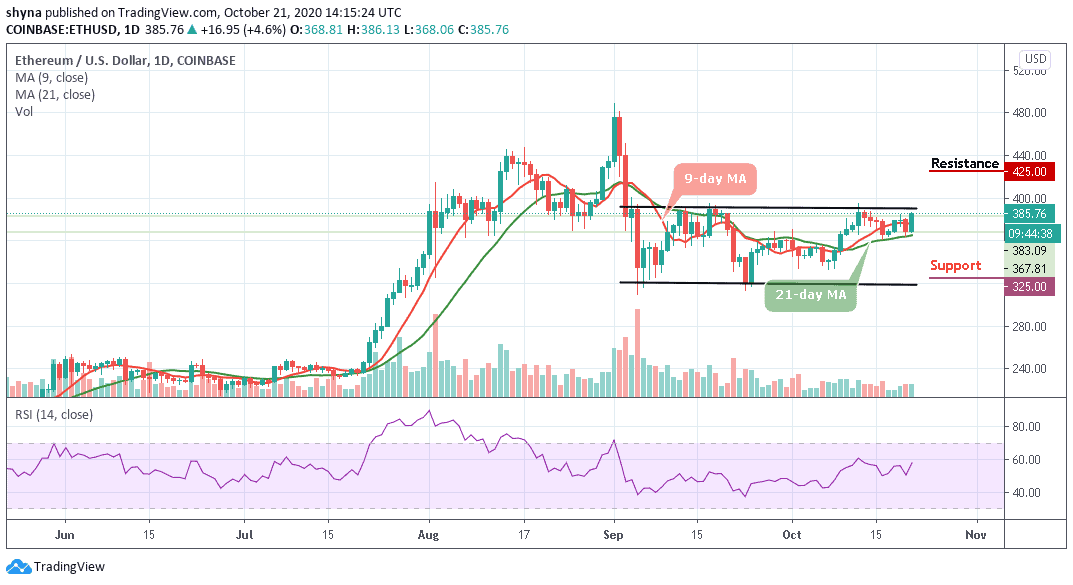
According to the daily chart, ETH/USD is impressively extending the bullish leg above $380, the price action has been significant enough to disapprove all negative predictions below the 9-day and 21-day moving averages. Yesterday, Ethereum tumbled and touched a $367 low and was unable to overcome the hurdles at $380 and $380 respectively.
What to Expect from Ethereum (ETH)
However, as of today, the impressive trading action is seen pulling ETH/USD not only above $370 but also $380. At the time of writing, Ethereum is trading around $385.76. Looking at the daily chart, we can see that ETH/USD even spiked higher into the resistance level at $386.13. Therefore, if the buyers continue to push the market higher, the immediate resistance above the $400 level will be located. Above this, further resistance levels lie at $425, $435, and $445.
Alternatively, if the bears step back into the market to bring down the price below the moving averages, the bears can expect immediate support to be located at $300. Further supports may be found at $325, $315, and $305 levels. Meanwhile, the RSI (14) may likely cross above the 60-level, signaling a more bullish movement.
When compares with BTC, the Ethereum price is clearly bearish. Meanwhile, as the price falls, sellers are posing an additional threat for buyers which may likely reach the 0.030 BTC where the nearest target is located. However, an eventual break below the lower boundary of the channel may cause the coin to collapse.
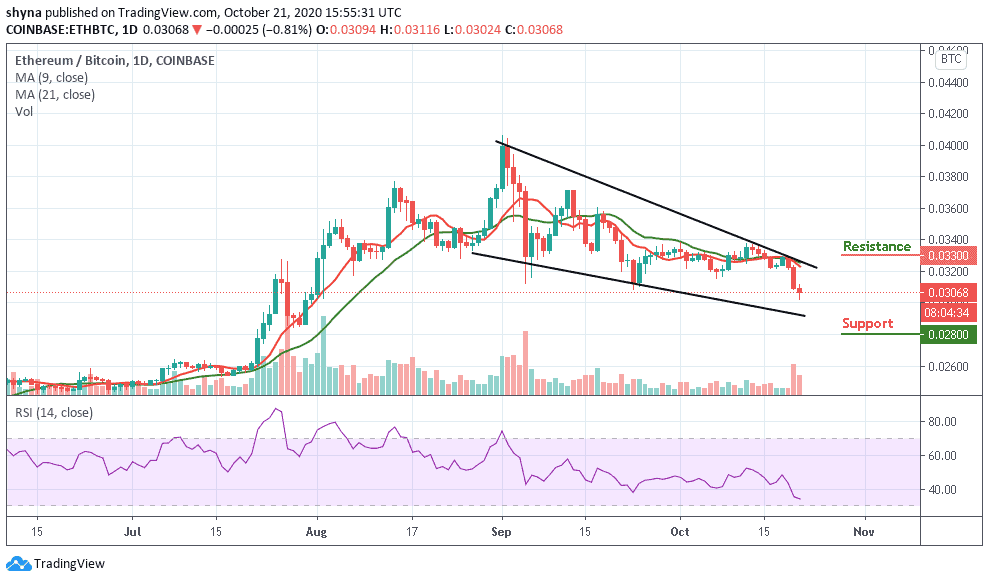
Moreover, a continuation of the downtrend could hit the main support at 0.029 BTC before falling to 0.028 BTC and below as the RSI (14) is seen moving around 36-level. However, if the price breaks above the channel, the buyers may resume back and push the market to the potential resistance at 0.033 BTC and above. Nevertheless, ETH will continue to fall if the sellers continue to release the pressure.
Join Our Telegram channel to stay up to date on breaking news coverage
