
Join Our Telegram channel to stay up to date on breaking news coverage
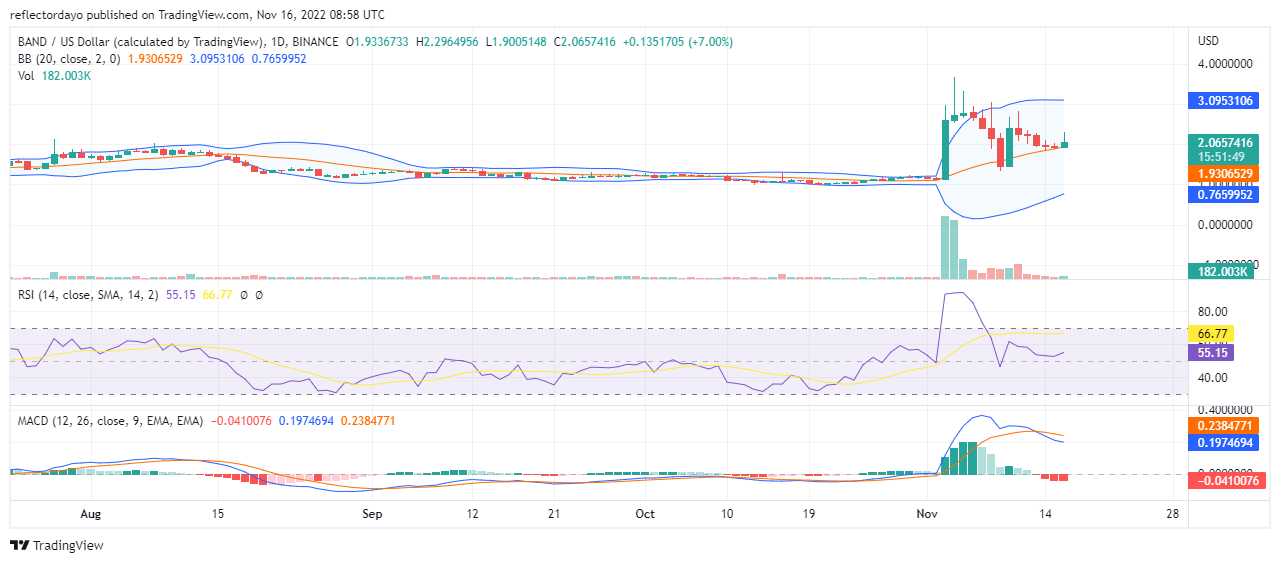
It was not until early November that the Band Protocol market experienced an explosive bullish price breakout. The market had been flat for a long time. Before now, it had no clear direction. The price just keeps moving at around $1.136 with a very narrow horizontally moving price channel. Now, the price channel is moving upward as bulls secure new higher supports
Band Protocol Market Price Statistic:
- BAND/USD price now: $2.08
- BAND/USD market cap: $71,434,641
- BAND/USD circulating supply:35,191,821.00
- BAND/USD total supply: 100,000,000
- BAND/USD coin market ranking: #255
Key Levels
- Resistance: $ 2.5, $3.0, $3.5
- Support: $1.5, $1.0, $0.5
Band Protocol Market Price Analysis: The Indicators’ Point of View
On November 3, we see a massive purchase of the token and the bullish price hit $3.000. Surprisingly, this strong bullish move did not immediately trigger strong selling pressure. However, it looks like the price could not go beyond the $3.000 resistance level. The bulls eventually succumb to the bearish resistance on November 6, but higher support was formed and the bulls prepares to face the $3.000 price level again. But now, the bulls have to face a new lower resistance. The resistance has shifted to the $2.4 price level. In the market today, we see new higher support. According to the Bollinger band indicator, the price channel changes direction to the upside. This is due to the new higher support that has just been formed. According to the RSI, the momentum measurement leans slightly to the bulls’ side as the line measures 55. But MACD’s sentiment favours the bears as the MACD line crosses below the signal. However, the line shows signs of an upward rebound.
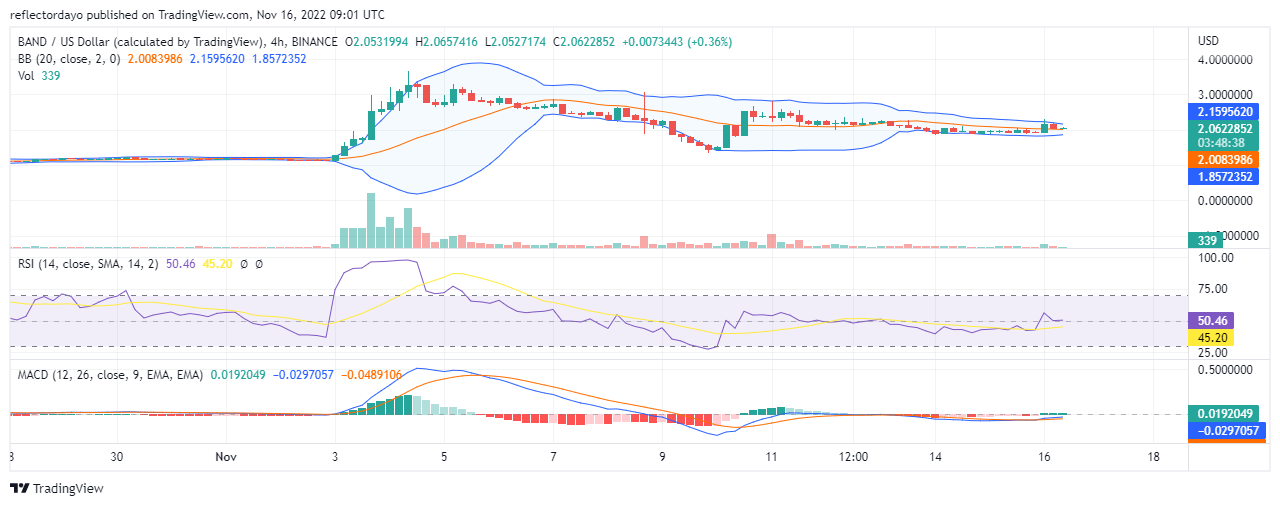
BAND/USD 4-Hour Chart Outlook
From this standpoint, we see the market price hanging exactly in the midpoint. The candlestick representing the third session is a doji. This portrays the tug-of-war in the session. Although the price channel becomes increasingly narrow, it appears the bulls have found another slightly higher support (resting on top of the simple moving average). The market is set for another bullish run that will take the price above $3.000
This Is the Best Time to Buy Dash 2 Trade (D2T)
This is the perfect time to buy D2T tokens, and one of the reasons for this is that CZ of Binance has already announced an industry recovery plan for crypto projects. The ongoing Dash 2 Trade presale has raised almost $6.5 million so far.
Related
Join Our Telegram channel to stay up to date on breaking news coverage