Join Our Telegram channel to stay up to date on breaking news coverage
Bitcoin (BTC) Price Prediction – July 24, 2020
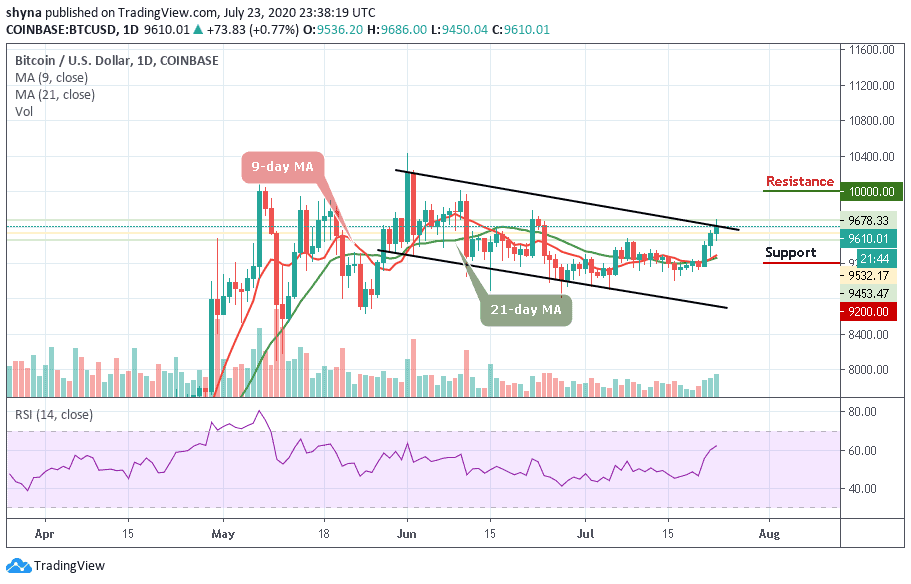
Following the recent rebound on July 22, BTC/USD has continued to hover above $9,500 support. The king coin has not been able to push above the $9,600 resistance in the last 48 hours. The reason is that the market has reached the overbought region.
Resistance Levels: $10,000, $11, 000, $12,000
Support Levels: $7,000, $6,000, $5,000
Bitcoin has rebounded thrice since it resumed uptrend above the $9,200 support level. The price has reached the $9,700 resistance zone. As BTC reached the overbought region sellers emerged to push prices down. The market is currently retracing to support. Bitcoin will resume trading in the upside range if price finds support to resume uptrend. The price will continue to fluctuate between $9,300 and $9,800 until the $10,000 overhead resistance is retested.
In the meantime, BTC is facing rejection at the $9,600 resistance. A break above the $9.600 resistance will push BTC to $9,800 high. Nonetheless, if the bulls break the next resistance at $9.800, a retest of the $10,000 overhead resistance is possible. However, Bitcoin is retracing to $9,500 support at the time of writing. A break below $9,500 support will push the coin to $9,200 low. Meanwhile, BTC has risen to level 62 of the Relative Strength Index period 14. It indicates that the market is in the uptrend zone.
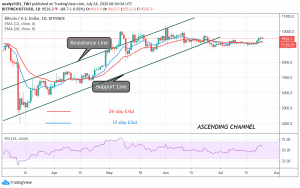
BTC/USD Medium-term Trend: Bullish (4-Hour Chart)
On the 4 hour chart, BTC has risen to a high of $9,685. The king coin is facing resistance at the high of $9,600. The price is retracing from the recent high to the previous lows.

If price finds support above $9,500, BTC will resume its uptrend. On the other hand, if price breaks below the support line of the ascending channel, the downtrend will resume. Technically, if price breaks a trend line and closes below it, the selling pressure will continue. The crypto is below 80 % range of the daily stochastic. It indicates that the market is in a bearish momentum.
Join Our Telegram channel to stay up to date on breaking news coverage