Join Our Telegram channel to stay up to date on breaking news coverage
USDCAD Price Analysis – July 11
The Bears require more pressure to break the demand level of $1.3058 which will expose the pair to $1.2930 level. Further increase in the Bulls’ momentum may increase the price to reach $1.3207 level.
USD/CAD Market
Key levels:
Supply levels: $1.3207, $1.3367, $1.3493
Demand levels: $1.3058, $1.2930, $1.2783
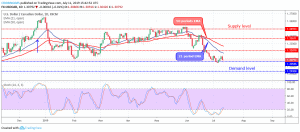
USDCAD Long-term trend: Ranging
USDCAD remains bearish on the long-term outlook. The currency pair was decreasing in the price for more than two weeks. Immediately the GBPUSD price tested the demand level of $1.3058 there was an interruption from the Bulls and the Bears could not push down the pair further. The Bulls momentum is not strong enough to push the price up; the price commenced sideways movement at $1.3058 level.
The currency pair is moving closer to the two EMAs. The 21 periods EMA and 50 periods EMA are above the price which indicates that the Bears’ momentum is getting weak. The Stochastic Oscillator period 14 is above 20 levels and the signal lines pointing upside to connotes buy signal.
The Bears require more pressure to break the demand level of $1.3058 which will expose the pair to $1.2930 level. Further increase in the Bulls’ momentum may increase the price to reach $1.3207 level.
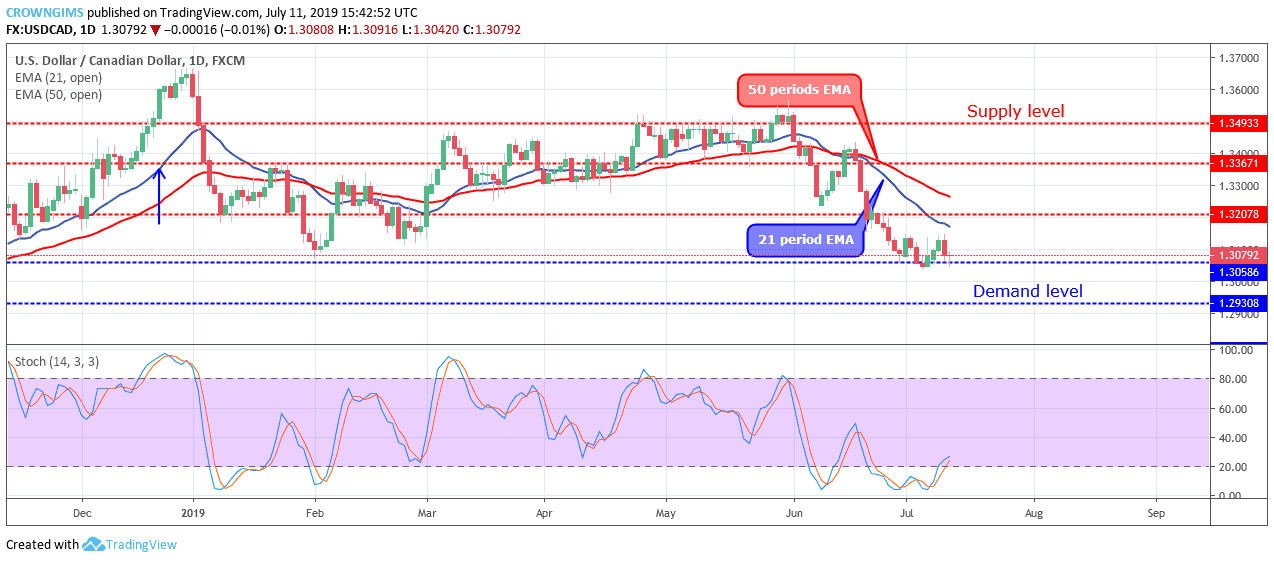
USDCAD medium-term Trend: Ranging
USDCAD is on the sideways movement in the medium-term outlook. USDCAD has been moving within the range of $1.3207 supply level and $1.3058 demand level since June 26. On July 04 the Bears tried to penetrate the $1.3058 level but were prevented by the Bulls. The Bears’ momentum is equally weak to push up the price.
USDCAD is trading over and around the 21 periods EMA and 50 periods EMA. The two EMAs are close to each other which indicate that consolidation is ongoing in the USDCAD market. The Stochastic Oscillator period 14 is below 20 levels and the signal lines bending up to indicate a buy signal.
Please note: insidebitcoins.com is not a financial advisor. Do your own research before investing your funds in any financial asset or presented product or event. We are not responsible for your investing results.
Join Our Telegram channel to stay up to date on breaking news coverage