Join Our Telegram channel to stay up to date on breaking news coverage
USDCAD Price Analysis – May 30
The Bulls eventually broke out at the former supply level of $1.3472 after a long period of consolidation. Uptrend may continue should the Bulls increase their momentum and the price may reach $1.3648. In case the Bears continue to interrupt the bullish movement, the price may continue on the ranging movement.
USD/CAD Market
Key levels:
Supply levels: $1.3648, $1.3845, $1.4012
Demand levels: $1.3472, $1.3330, $1.3207
USDCAD Long-term trend: Bullish
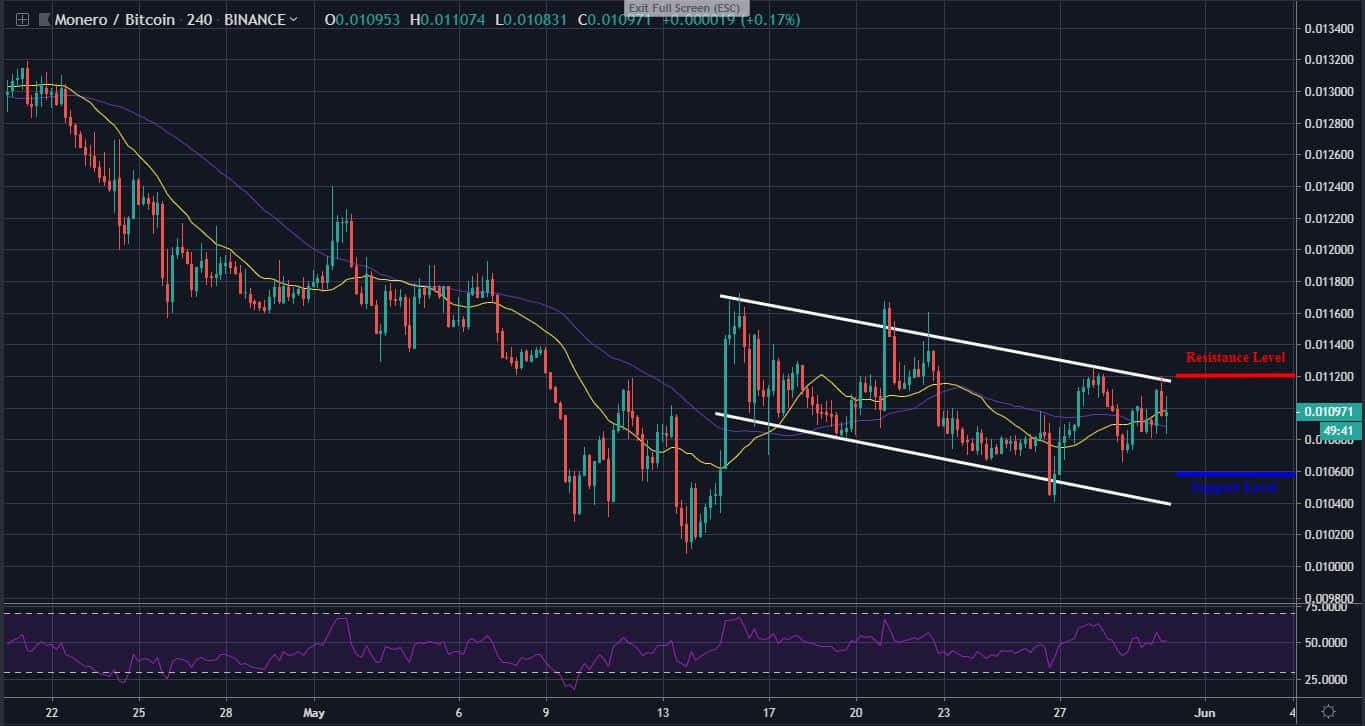
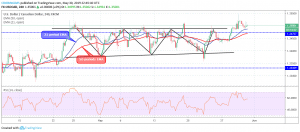
On the long-term outlook, USDCAD is bullish on the daily chart. Last week, USDCAD was on the sideways movement on the daily chart within the channel formed. On May 22, a bullish engulfing candle formed that triggered the bullish momentum. The USDCAD price rallied to the north and broke up the supply level of $1.3648. On May 30, a daily bearish candle emerged as a price retracement on the daily chart.
The currency pair has crossed the 21 periods EMA and 50 periods EMA upside and the two EMAs are bending up following the market trend. The Relative Strength Index period 14 is below 60 levels with the signal line flat horizontally to indicate that the price may consolidate. Uptrend may continue should the Bulls increase their momentum and the price may reach $1.3648. In case the Bears continue to interrupt the bullish movement, the price may continue on the ranging movement.
USDCAD medium-term Trend: Bullish
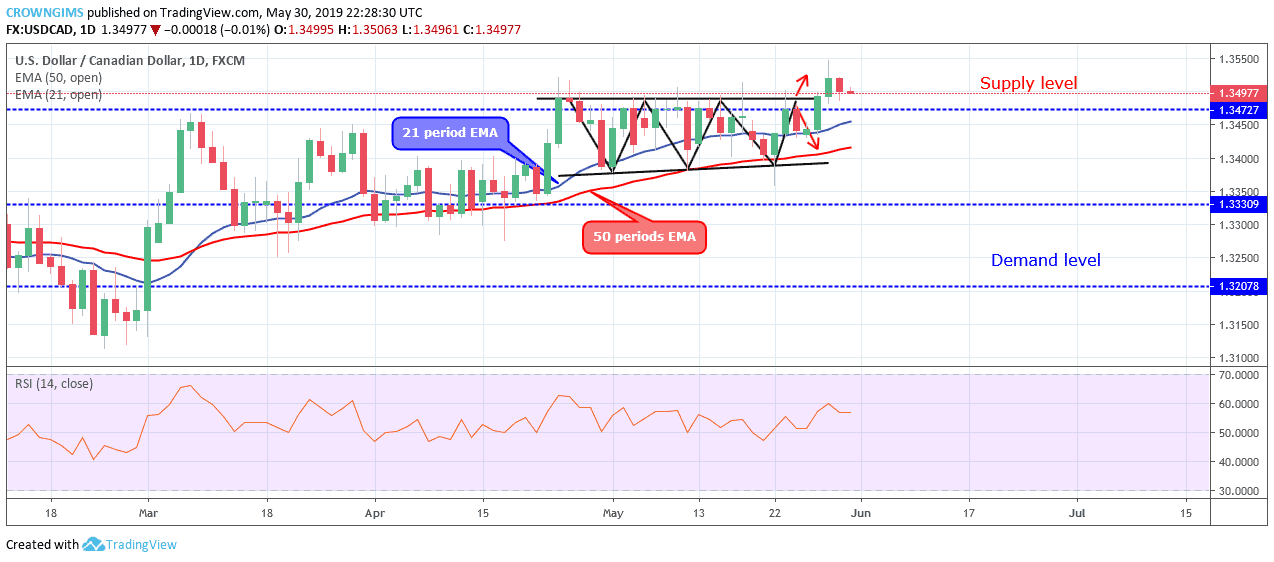
USDCAD is bullish in the medium-term outlook. The Bulls eventually broke out at the former supply level of $1.3472 after a long period of consolidation. The USDCAD price is currently heading towards $1.3678 supply level.
The 21 periods EMA has crossed the 50 period EMA upside as a sign of bullish trend and the price is trading above the two EMAs. The Relative Strength Index period 14 is at 60 levels with the signal line pointing to the north to indicate a buy signal.
Please note: insidebitcoins.com is not a financial advisor. Do your own research before investing your funds in any financial asset or presented product or event. We are not responsible for your investing results.
Join Our Telegram channel to stay up to date on breaking news coverage