Join Our Telegram channel to stay up to date on breaking news coverage
Tron (TRX) Price Analysis – July 14
The sellers are in control of the long-term outlook. The loyal traders of Tron believe the coin has a high prospect of recovery in the future. We are also positive about the same.
TRX/USD Market
Key Levels:
Supply levels: $0.040, $0.042, 0.044
Demand levels: $0.020, $0.018, $0.016
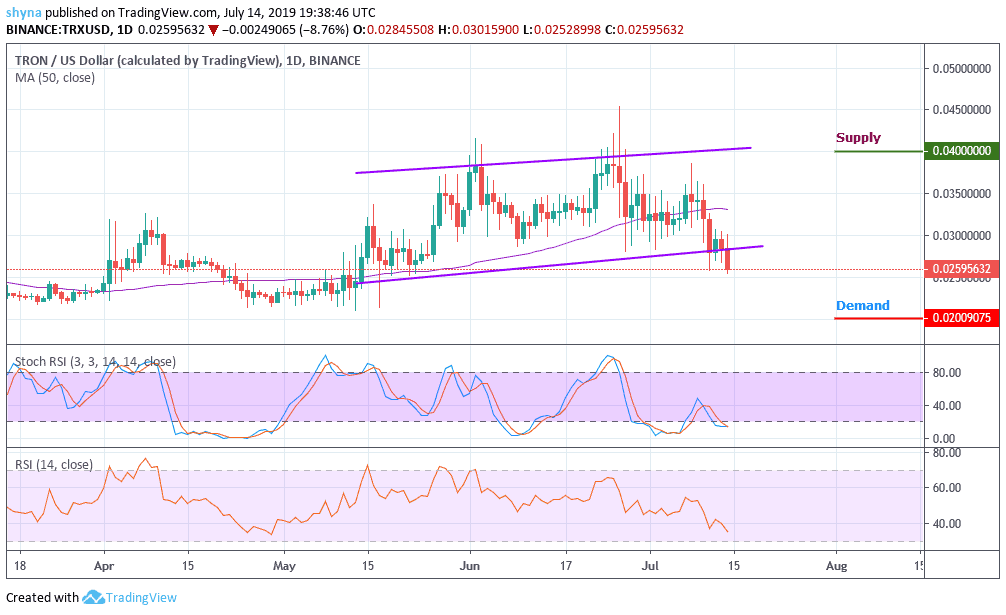
The crypto market is finding many of its coin in deep waters. Tron (TRX) is one of them. A few days back, TRX was handling the market pressure extremely well. The coin kept the price to $0.032 or $0.031. But, the currency has lost the momentum and is currently dealing at $0.027. Yesterday, the coin opened at $0.029. The coin immediately slipped from $0.029 to $0.027. The downfall was of 5.59% and there was another fall, which took the price from $0.0276 to $0.0274. The coin closed at $0.028.
Today, the coin booked a subsequent growth of 3.17% as the coin opened at $0.028 and went up to $0.029. At the time of writing, the TRX price is $0.025 and the bears are trying to bring the price below $0.025 level which may likely reach the demand at $0.020, $0.018 and $0.016 levels as the stochastic RSI and RSI (14) are facing the oversold zone. Meanwhile, the buyers may likely find the supply levels at $0.040, $0.42 and $0.44, if they decide to move the price upward.
TRX/BTC Market
After the bearish sentiment, the TRX/BTC has not yet reached a significant milestone above the important purple line of the 50-day moving average as the market continues to hold steady. This suggests that bears dominate the market. Meanwhile, the MACD is in decline level. In fact, the signal is synonymous with long-term RSI, which has set the head towards the oversold condition.
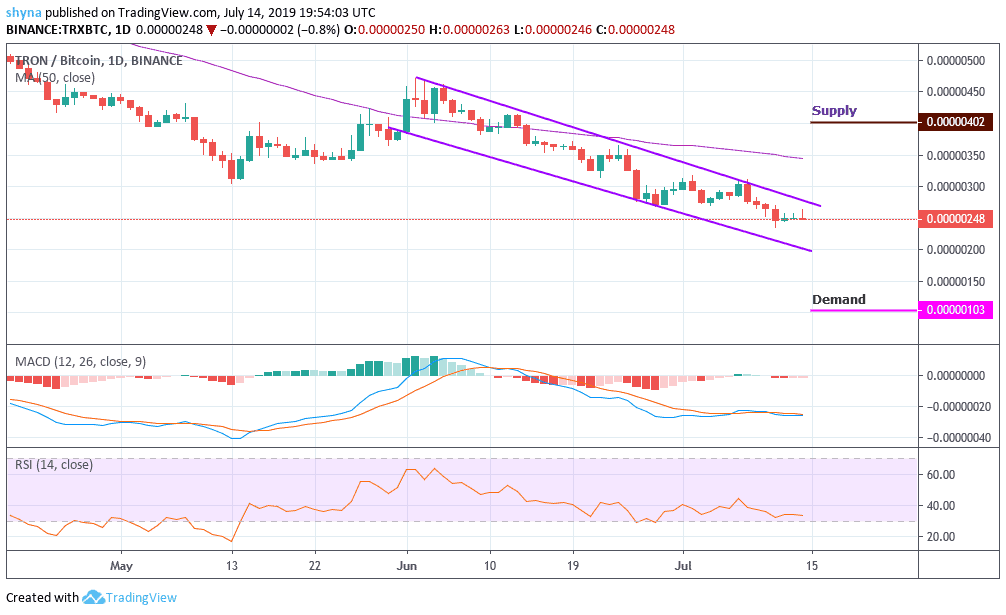
In addition, selling pressure may provide support around the 103SAT level. Breaking this level can lead to a bearish pursuit, finding the next support around the 101SAT. However, if the market reverses, we can expect a potential buying pressure from the 402SAT resistance and above. However, it is necessary for a surge to exit the market of the bearish zone as TRX/BTC follows a bearish scenario for the moment.
Please note: insidebitcoins.com is not a financial advisor. Do your own research before investing your funds in any financial asset or presented product or event. We are not responsible for your investing results.
Join Our Telegram channel to stay up to date on breaking news coverage