Join Our Telegram channel to stay up to date on breaking news coverage
Tron (TRX) Price Analysis – September 16
Tron (TRX) coin is yet to display a significant bullish move as the market continues to move in sideways.
TRX/USD Market
Key Levels:
Resistance levels: $0.018, $0.020, 0.022
Support levels: $0.012, $0.010, $0.008
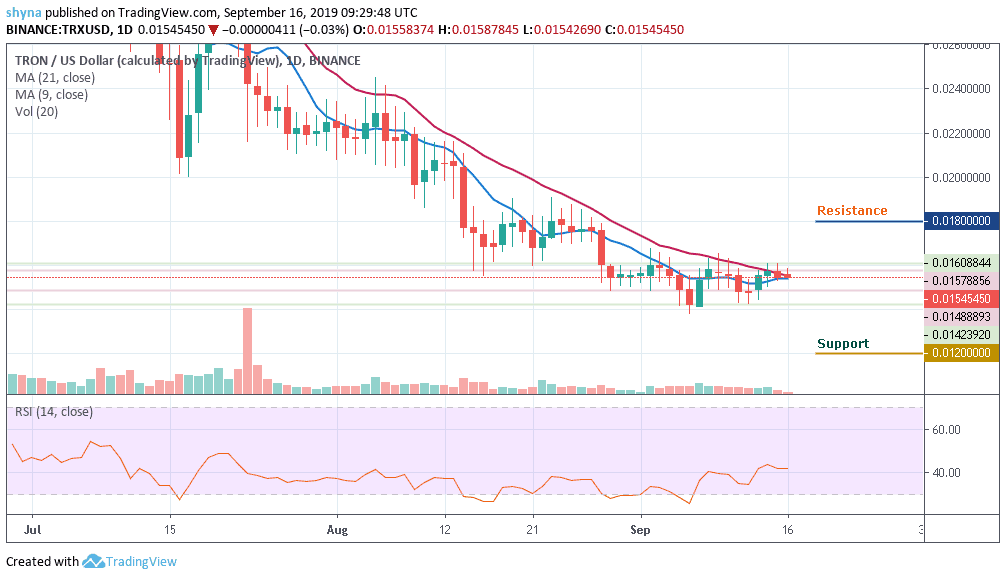
TRX/USD remained indifferent out of all falling cryptos. Last two days were extremely bullish, wherein the price rose from $0.014 to $0.015. Today, the price has gone up to $0.016 but currently, the price is trying to trend below the moving averages of 9-day and 21-day as the trading volume decreases. While TRX remains in an unstable market, a price surge is more likely to play out.
However, for an upsurge, TRX/USD is likely to meet the nearest resistances at $0.018, $0.020, and $0.022 before we can consider more levels for the trade. A down surge, however, could plummet the market to $0.012, $0.010 and $0.008 supports after a possible break at $0.014. The RSI has maintained trading in sideways and moving towards the 40-level, showing an indecisive movement.
TRX/BTC Market
Against Bitcoin, Tron (TRX) is trading on the upside, although the price action has remained intact within the moving averages. As the trading volume is low, if selling pressure resumes, the TRX price variation may likely continue the downtrend. For now, the RSI (14) is moving above level 40 which makes the market to be indecisive at the moment.
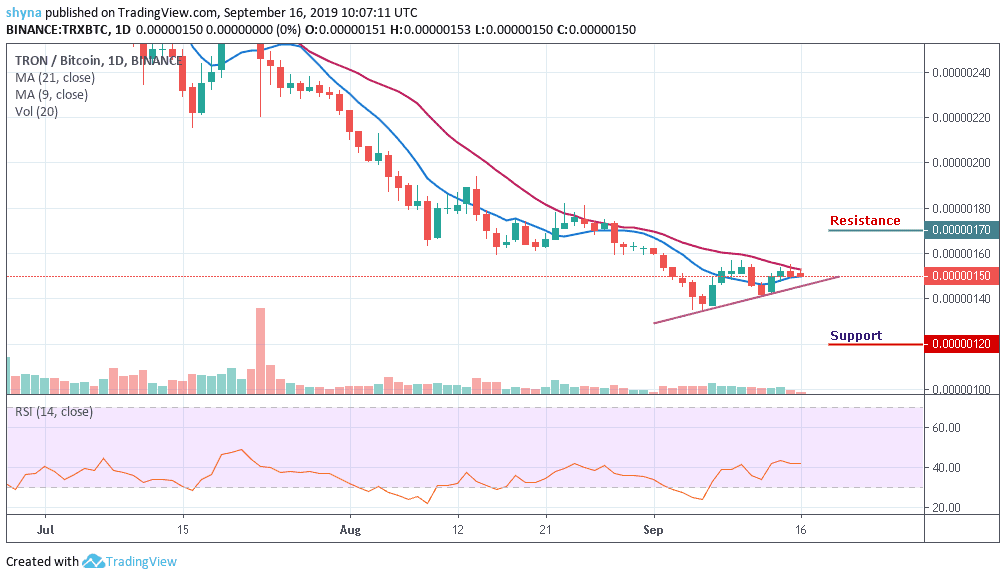
Similarly, the coin is currently trading around the moving averages of 9-day and 21-day at 150SAT. We can expect close support at the 120SAT before breaking to 110SAT and potentially 100SAT levels. Moreover, if the bullish move continues and validates a break significantly above the moving averages; we can then confirm a bull-run for the market and the closest resistance levels lie at 170SAT, 180SAT, and 190SAT.
Please note: Insidebitcoins.com is not a financial advisor. Do your research before investing your funds in any financial asset or presented product or event. We are not responsible for your investing results.
Join Our Telegram channel to stay up to date on breaking news coverage