Join Our Telegram channel to stay up to date on breaking news coverage
Tron (TRX) Price Analysis – August 18
The TRX/USD pair is maintaining a downtrend as the bears come together to increase selling pressure in the market.
TRX/USD Market
Key Levels:
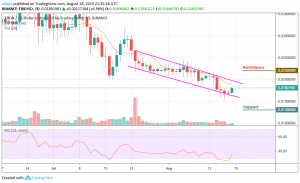
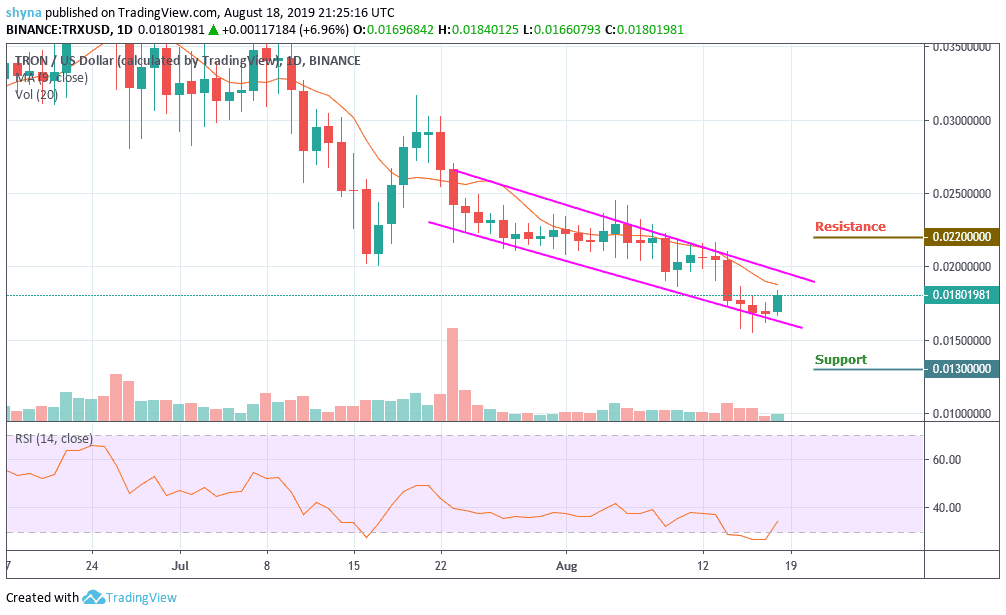
Resistance levels: $0.022, $0.024, 0.026
Support levels: $0.013, $0.011, $0.009
Tron (TRX) is fluctuating in the bearish zone, which might be a little concern as of now. The main question is when Tron will slide to the profit zone? It seems that traders might have to bear some patience to enjoy some returns in the Tron network. Meanwhile, they might want to work upon avoiding any losses if the value is dropped every day.
However, the TRX/USD pair is maintaining a downtrend as the bears are preparing for more selling pressure.
Looking at the daily chart, the market is consolidating and the potential supports lies at $0.013, $0.011 and $0.009 levels. However, if the bull could step back into the market, a trend reversal may resurface and push it to the resistance levels at $0.022, $0.024 and $0.026. The RSI (14) is recovering from the oversold zone, which may likely give some bullish signals.
TRX/BTC Market
Against Bitcoin, TRX is currently changing hands at 172 SAT and if the bulls can hold the price tight as it is, the next key targets price lies at 200 SAT and 220 SAT respectively. Reaching these levels may likely move the market to 240 SAT level. Meanwhile, RSI (14) is trying to recover from the oversold and may likely give some possible bullish signals for the next few today.
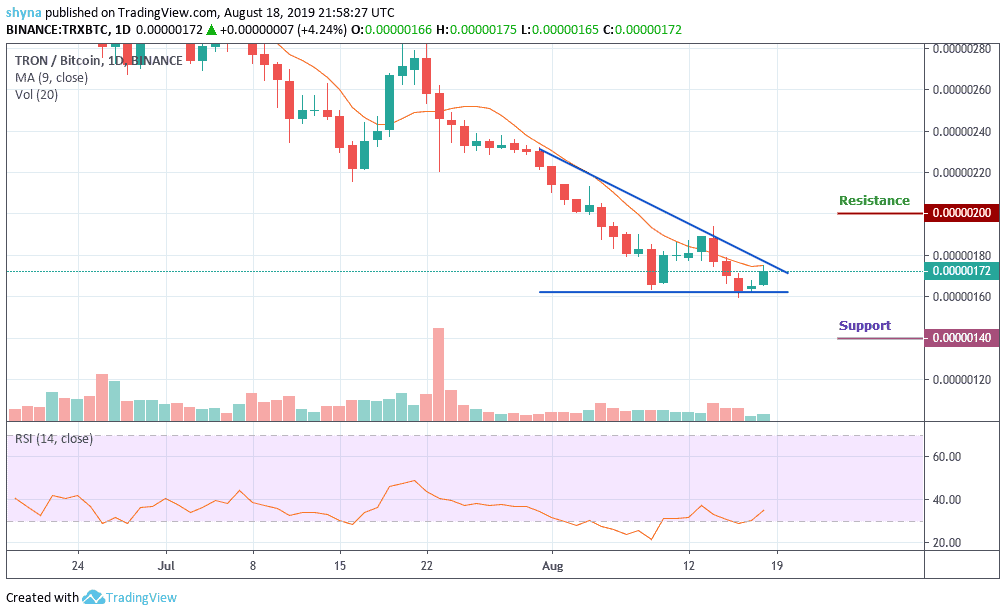
However, if the bulls failed to push the price to the nearest resistance, the market could resume its bearish trend. More so, Tron price may likely see a sharp drop at 160 SAT support level as it moves below the 21-day moving average. Breaking this level could further push the market to the nearest support levels at 140 SAT, 120 SAT, and 110 SAT.
Please note: insidebitcoins.com is not a financial advisor. Do your research before investing your funds in any financial asset or presented product or event. We are not responsible for your investing results.
Join Our Telegram channel to stay up to date on breaking news coverage