
Join Our Telegram channel to stay up to date on breaking news coverage
If the Graph price prediction prepares for the uptrend, the coin will be technically and fundamentally ready to break above $0.200.
The Graph Prediction Statistics Data:
- GRT price now – $0.155
- GRT market cap – $1.3 billion
- GRT circulating supply – 8.8 billion
- GRT total supply – 10.6 billion
- GRT Coinmarketcap ranking – #44
GRT/USD Market
Key Levels:
Resistance levels: $0.220, $0.240, $0.260
Support levels: $0.095, $0.075, $0.055
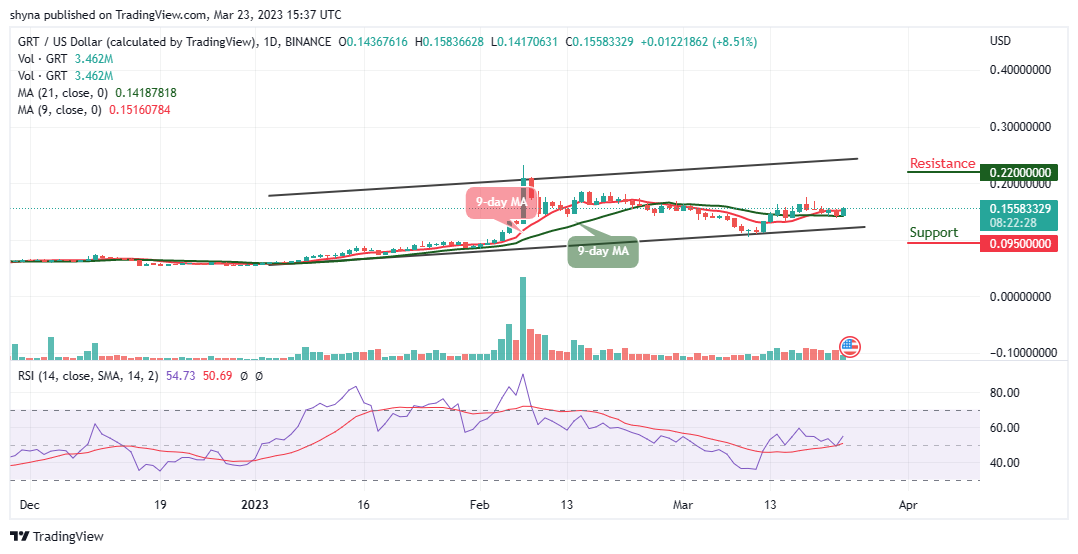
GRT/USD is seen trading above the 9-day and 21-day moving averages as the coin may kick-start a bullish run above $0.150. However, the break above the moving averages is the first signal needed for a bullish to press higher. Nevertheless, the Graph price has to break above $0.180 before hitting $0.200.
The Graph Price Prediction: What to Expect from the Graph
Looking ahead, if the Graph price continues to grind higher, the first resistance level may come at $0.180 as this could also be followed by $0.200. However, additional resistance may now be found at $0.220, $0.240, and $0.260 respectively. On the other side, if the Graph price moves below the lower boundary of the channel, it could hit the first support level at $0.130.
Beneath this, staying below this barrier may lead to the critical support levels at $0.095, $0.075, and $0.055. Meanwhile, the technical indicator Relative Strength Index (14) poked itself above the 50-level, which indicates that buyers are attempting to gain control of the market momentum.
Against Bitcoin, the daily chart shows that the Graph price is attempting to cross above the 9-day and 21-day moving averages at 570 SAT. However, if the coin can make a bullish cross above the moving averages, there is a possibility that additional benefits could be obtained in the long term. Therefore, the next resistance key above this level is close to the 700 SAT level. If the price keeps rising, it could even break the 800 SAT and above.
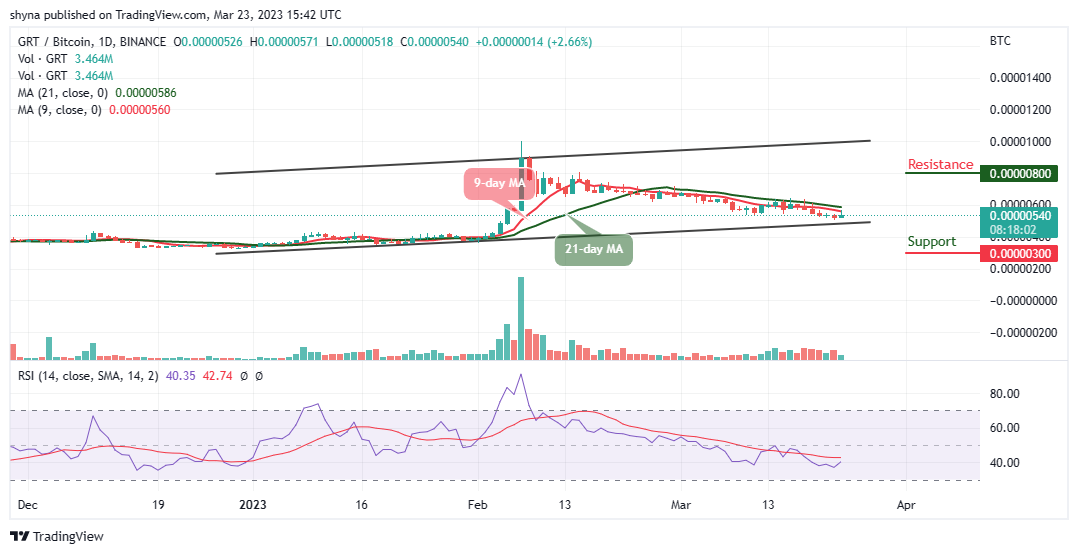
However, if the bears regroup and move below the lower boundary of the channel, the support level of 400 SAT may play out before rolling to the critical support at 300 SAT and below. Meanwhile, the Relative Strength Index (14) is moving to cross above the 40-level, suggesting more bullish signals.
Alternatives to the Graph
At the time of writing, the Graph price will spike higher if the coin continues to follow the bullish movement as it could soon cross above the upper boundary of the channel. Meanwhile, the Love Hate Inu token is the world’s first blockchain-based online voting platform and it is still very hot at the moment as it has raised close $2 million in the presale. Therefore, investors that are interested are to move quickly before it expires.
Join Our Telegram channel to stay up to date on breaking news coverage