
Join Our Telegram channel to stay up to date on breaking news coverage
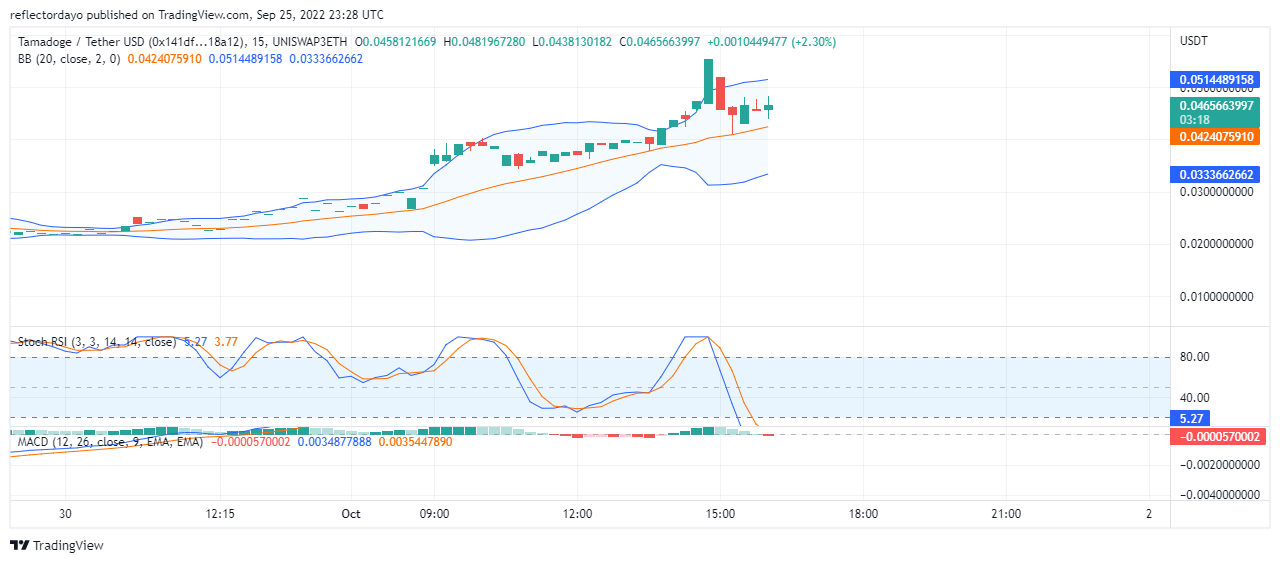
In the 15th hour of today’s Tamadoge market price analysis buyers took control of the first 15 minutes of that session with a very significant bullish candlestick. It shows that for that particular session, sellers could not find space in the market. However, because the bullish move was so powerful, it quickly entered the overbought zone and as a result, traders took profits. However, Buyers are coming back again and the market is pumping.
Tamdoge Market Price Statistic:
- TAMA/USD price now: $0.0426185274
- TAMA/USD market cap: $44,674,229
- TAMA/USD circulating supply:1,000,000,000
- TAMA/USD total supply: 1,049,733,333
- TAMA/USD coin market ranking: #2674
Key Levels
- Resistance: $0.0468593820, $0.0513896719 $0.0552048067
- Support: $0.03445326500, $0.030000000, $0.0250000000
Tamadoge Market Price Analysis: The Indicators’ Point of View
The indication is fast as the price retracement sent the RSI line and the Signal line into the oversold zone. The implication of this is that the bullish trend will soon continue because the market would correct itself back to the upside.
This is why the MACD lines did not make much downward retracement (being a slower indicator) because there is a possibility that the bullish trend will continue.
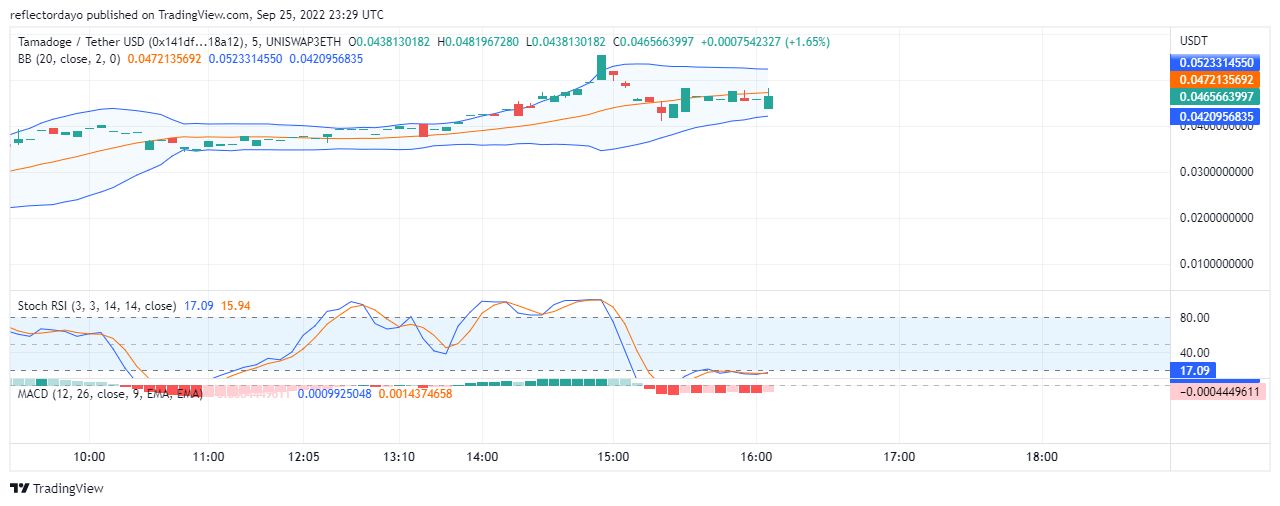
Tamadoge: TAMA/USD 5-Minute Chart Outlook
The lines of Tamadoge‘s Relative Strength Index are recovering and are now moving at the threshold of the lower market measurement. At the moment the market measures 17% as the buyer pushes the price up again. In the Relative Strength Index, the last bearish histogram has changed colour from red to pink. This is a sign of increasing buying pressure.
View the latest Tamadoge price on CoinCodex.
Join Our Telegram channel to stay up to date on breaking news coverage