Join Our Telegram channel to stay up to date on breaking news coverage
XRP Price Analysis – March 23
Following the last bearish impulse on March 12, XRP/USD pair consolidates between $0.12 and $0.17. The bears intend to provide stiff resistance above the overhead resistance. In the XRP/BTC pair, the price consolidates above Ƀ0.00002600 because the upward move is being interrupted at Ƀ0.00003200.
XRP/USD Market
Key Levels:
Resistance Levels: $0.24, $0.26, $0.28
Support Levels: $0.22, $0.20, $0.18
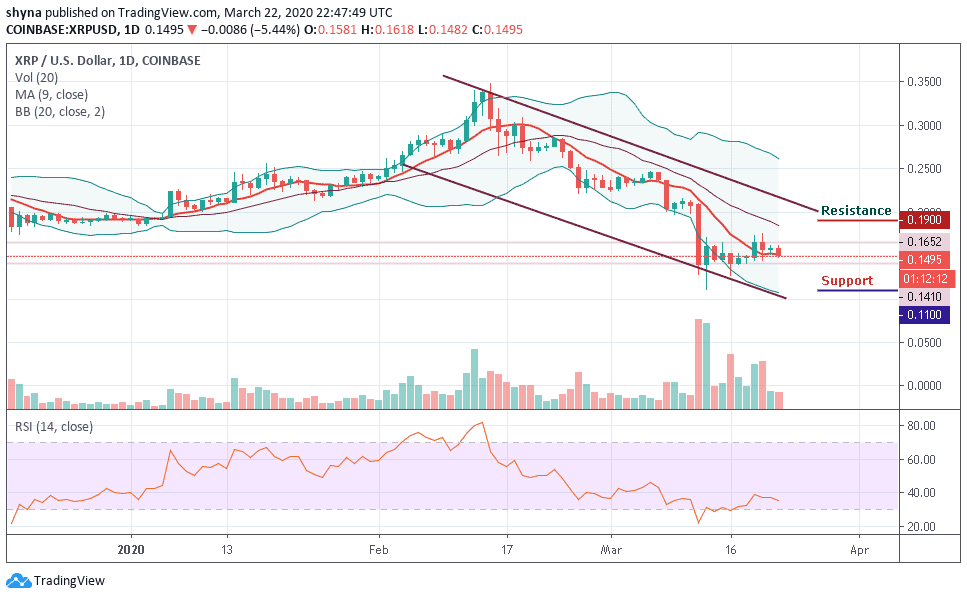
Ripple has earlier been in the oversold region as it trades at the bottom of the chart. Presently, Ripple has been confined between the levels of $0.12 and $0.17. The market fluctuates within the price range. Neither the bulls nor the bears have broken the key levels. Assuming, the bulls break the $0.17 resistance, XRP will rally above $0.20 and resumes the uptrend. Nonetheless, the bulls have made concerted efforts to break the overhead resistance without success.
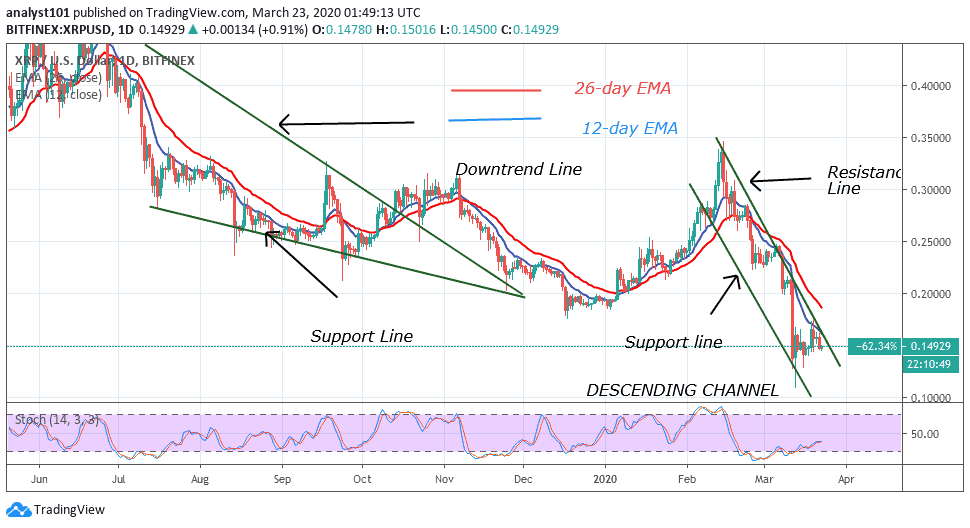
On March 19, XRP was purchased as the market makes an upward move to retest the $0.17 resistance. The uptrend was interrupted as the bulls were repelled at the $0.16 price level. XRP is falling from a high of $0.16 and approaching the low of $0.14. Nonetheless, XRP is above 20% range of the daily stochastic. It indicates that the market is in bullish momentum. Besides, buyers are likely to emerge in the oversold region to push XRP upward.
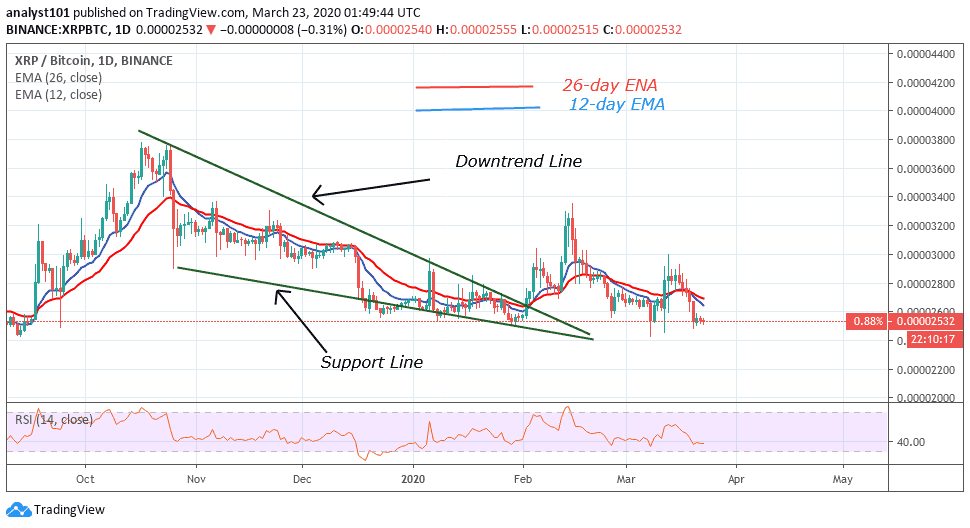
Similarly, on the XRP/BTC chart, the market was in an uptrend. The bulls broke the downtrend line to resume an upward move. The upward move was interrupted at the Ƀ0.000032200 resistance. Simultaneously, the market dropped to the low above Ƀ0.00002600. Meanwhile, the pair is at level 38 of the Relative Strength Index. It indicates the price is in the downtrend zone.
Please note: Insidebitcoins.com is not a financial advisor. Do your research before investing your funds in any financial asset or presented product or event. We are not responsible for your investing results.
Join Our Telegram channel to stay up to date on breaking news coverage