Join Our Telegram channel to stay up to date on breaking news coverage
Ripple Price Prediction – September 3
The Ripple price is rising with a gain of 3.97% over the past 24 hours as it rises above the $1.30 level.
XRP/USD Market
Key Levels:
Resistance levels: $1.45, $1.50, $1.55
Support levels: $1.10, $1.05, $1.00
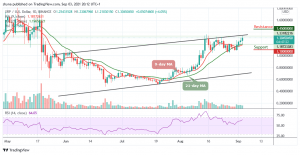
XRP/USD is now holding strong above $1.30 after touching the daily low of $1.21 support. Moreover, it could be possible that the more the resistance level of $1.35 is tested, the more it is likely to break higher. Therefore, if the Ripple price crosses below the 9-day and 21-day moving averages, traders could expect the coin to break beneath and this may likely test the critical support levels of $1.10, $1.05, and $1.00.
Ripple Price Prediction: Ripple Price Needs To Keep the Upside
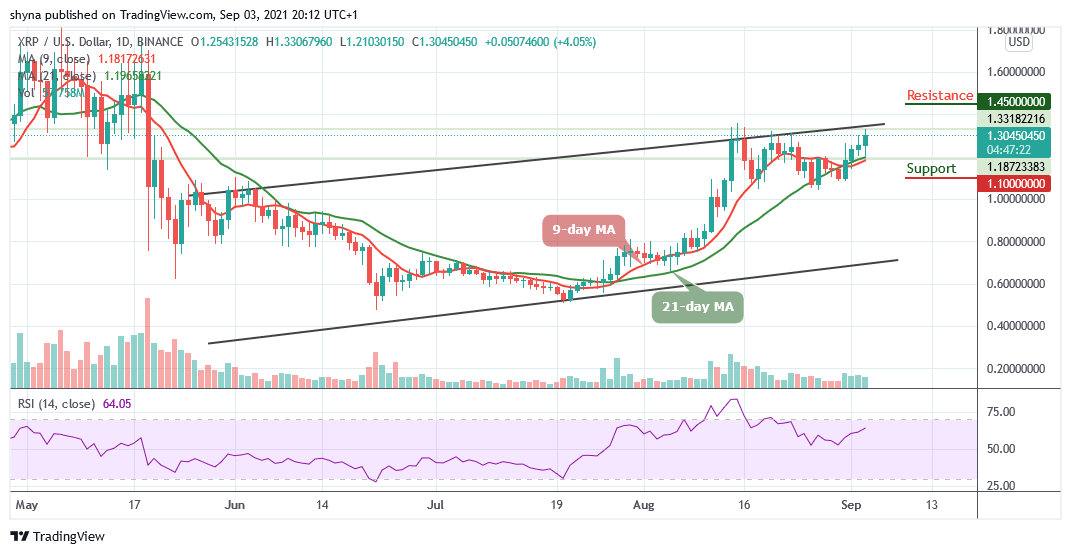
According to the daily chart, the Ripple price is hovering around $1.30 with a slightly bullish movement towards the upper boundary of the channel. However, should in case the bulls put more pressure, the Ripple price may hit the resistance levels of $1.45, $1.50, and $1.55. Moreover, the technical indicator Relative Strength Index is beginning to move towards the overbought region as the signal line crosses above 60-level.
Comparing with Bitcoin, the Ripple price has been trading nicely above the 9-day and 21-day moving averages. After touching the low of 2503 SAT, the price begins to slowly ascend as it is currently trading around the 2602 SAT. However, the Ripple price is now contained within the channel as traders wait for bulls to hopefully push the price above the upper boundary of the channel.
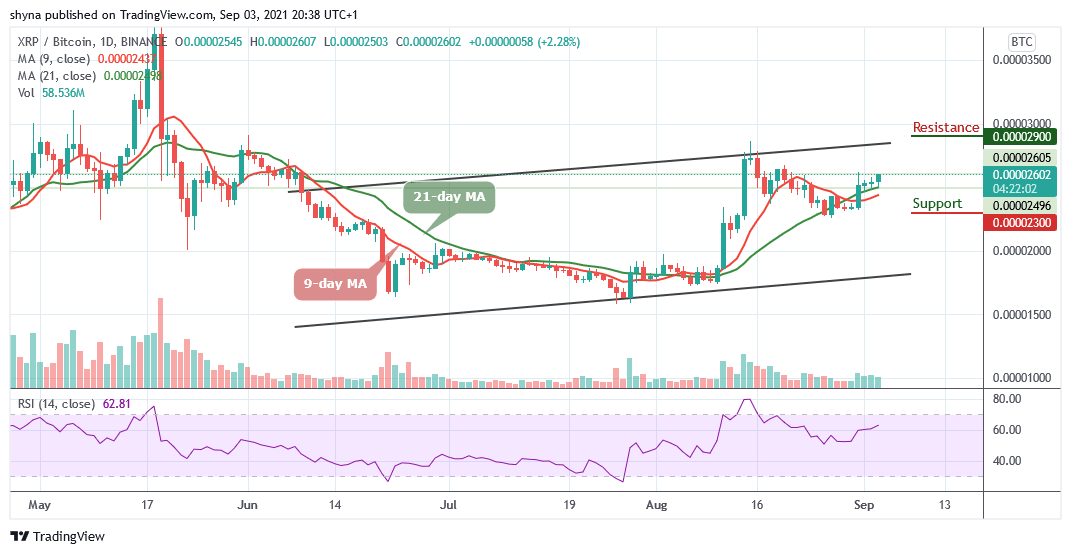
Moreover, if the bulls can break above this barrier, traders can expect initial resistance at 2800 SAT. Above this, higher resistance is located at 2900 SAT and above. In other words, if bears push the market below the moving averages, XRP/BTC may hit the critical support at 2300 SAT and below. Meanwhile, the Relative Strength Index (14) is above 60-level to cross into the overbought region and it may likely create more bullish movements.
Looking to buy or trade Ripple (XRP) now? Invest at eToro!
75% of retail investor accounts lose money when trading CFDs with this provider
Join Our Telegram channel to stay up to date on breaking news coverage