Join Our Telegram channel to stay up to date on breaking news coverage
Ripple Price Prediction – January 10
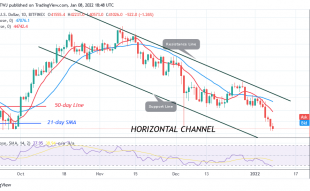
The Ripple price prediction is seen in the bearish scenario as XRP faces the negative side to cross below the lower boundary of the channel.
XRP/USD Market
Key Levels:
Resistance levels: $0.85, $0.90, $0.95
Support levels: $0.60, $0.55, $0.50
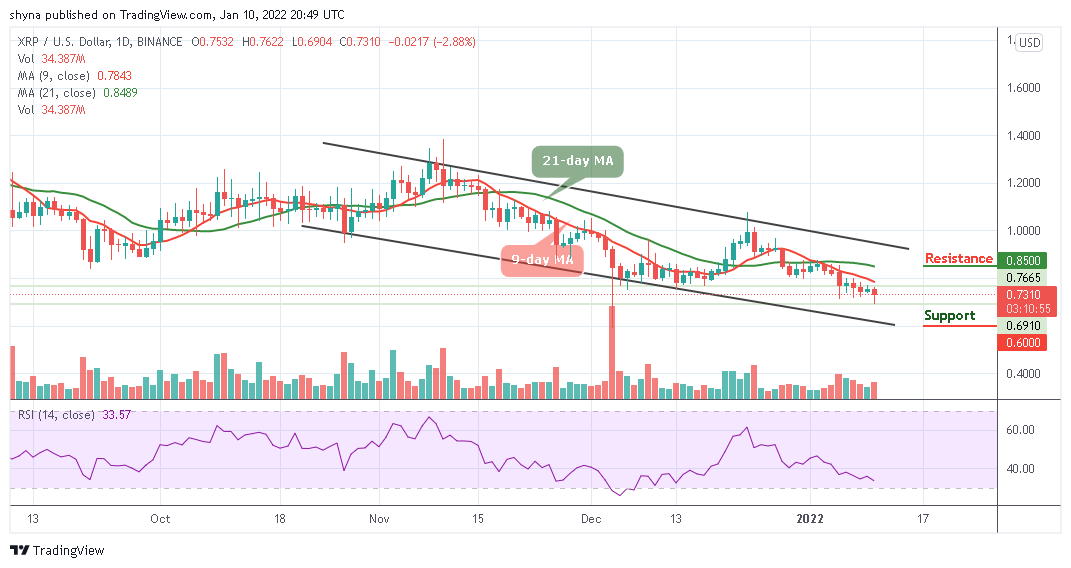
Looking at the chart, XRP/USD is currently trading at $0.73, moving below the 9-day and 21-day moving averages. The Ripple price may remain at the downside as the 9-day MA stays below the 21-day MA. At the time of writing, there is not any promising movement by the bulls as the bears are dominating the market heavily.
Ripple Price Prediction: Ripple (XRP) May Remain at the Downside
The daily chart reveals that the Ripple price is not yet ready for the upside as the coin prepares to break to the south with heavy bearish movement. However, if XRP/USD begin a bullish movement, and crosses above the 9-day moving average, the coin may likely touch the resistance levels at $0.85, $0.90, and $0.95 respectively.
Moreover, with the looks of thing, any further bearish movement below the lower boundary of the channel could hit the support levels at $0.60, $0.55, and $0.50. Meanwhile, a rise from the resistance level at $0.76 could lead to volatility and instability, but it’s technically important for the bulls to hold the current movement below the moving averages as the technical indicator Relative Strength Index (14) keeps supporting the bears.
XRP/BTC Market: Ripple Price Consolidates to the Downside
Against Bitcoin, the bearish movement is seen as the Ripple price slides below the 9-day and 21-day moving averages and the support at 1800 SAT level has been broken down. The price is set to test 1700 SAT if the coin continues to head to the south. On other hand, the bulls could push XRP/BTC above the moving averages to hit the resistance level of 1900 SAT and above.
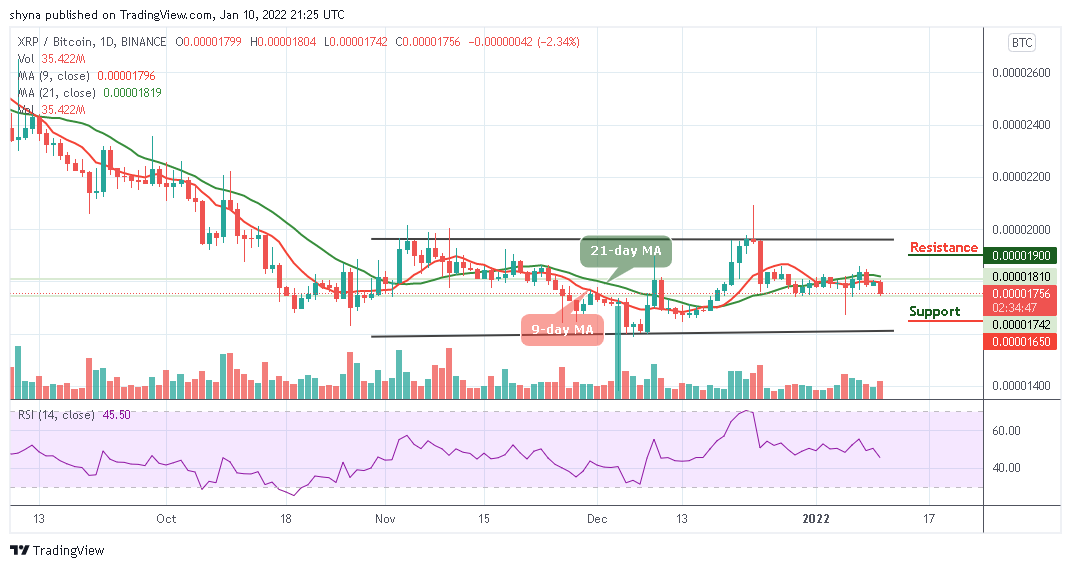
However, the bearish scenario remains dominant within the channel as the bears are putting pressure on the bulls. If the bears occupy their positions, XRP/BTC may drop to support level of 1650 SAT and below. At present, the Relative Strength Index (14) is likely to cross below40-level, which could introduce more bearish signals into the market.
Looking to buy or trade Ripple (XRP) now? Invest at eToro!
68% of retail investor accounts lose money when trading CFDs with this provider
Join Our Telegram channel to stay up to date on breaking news coverage