Join Our Telegram channel to stay up to date on breaking news coverage
Ripple Price Prediction – June 30
The Ripple price is hovering at $0.67 as it lacks imminent support and therefore, trades in the red with dense selling pressure.
XRP/USD Market
Key Levels:
Resistance levels: $1.00, $1.10, $1.20
Support levels: $0.35, $0.25, $0.15

XRP/USD is now down at a low of $0.64 and the weakness of Ripple (XRP) is quite apparent now as the digital asset will have very little support on the way down to $0.45. However, traders should take note that most of the market is also seeing red numbers, major coins have been holding on quite well. The Ripple bulls will now need to see a bounce from any support level to have any chance to recover their daily uptrends.
Ripple Price Prediction: The Coin May Break to the Downside
Looking at the daily chart, if the Ripple price fails to climb above the 21-day moving average, there could be a bearish reaction. At the moment, the initial support is near below the 9-day moving average. Therefore, if there is a downside break below this barrier, the Ripple price could test $0.60. However, any further losses might start another bearish wave and the price could even decline below the $0.35, $0.25, and $0.15 support levels.
However, as the technical indicator Relative Strength Index (14) moves below the 45-level but at the upside, the break above the 9-day moving average, the nearest resistance level is located at $0.85 level while the price could move towards the upper boundary of the channel. This bullish movement may likely hit the potential resistance levels at $1.00, $1.10, and $1.20 respectively.
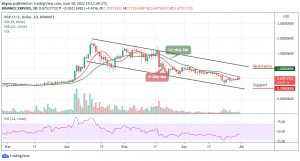
Against Bitcoin, the Ripple price moves within the 9-day and 21-day moving averages as the price action has remained intact within the channel. However, if the selling pressure resumes, the Ripple price variation may close this month with a new low. At the moment, the Relative Strength Index (14) is moving sideways; traders may see the coin ranging.
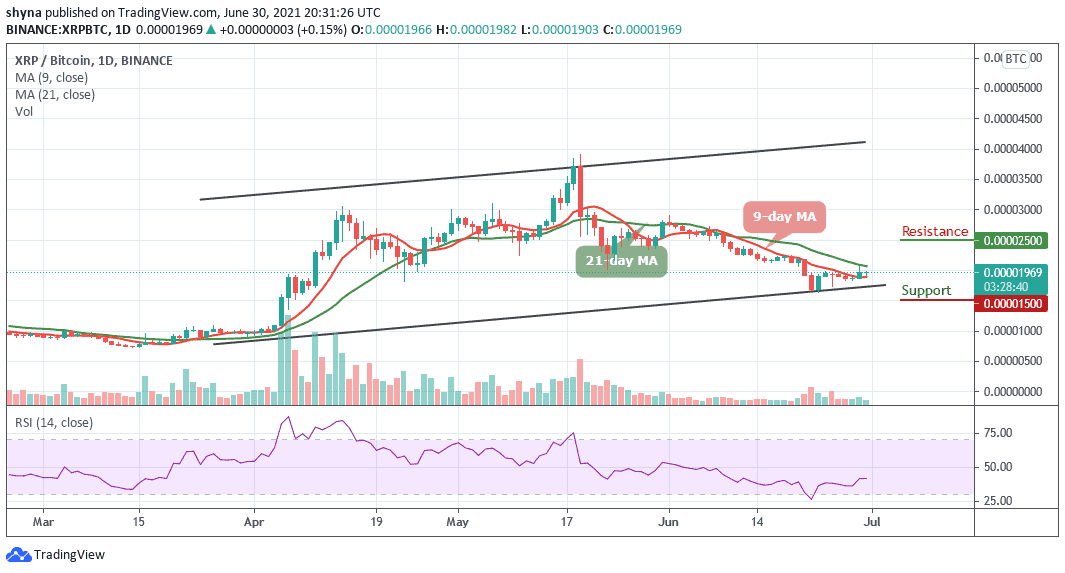
Moreover, the Ripple price is currently hovering at 1969 SAT. Therefore, it is expected for the coin to hit close support at 1500 SAT before breaking to 1400 SAT and critically 1200 SAT levels. Meanwhile, if a bullish movement occurs and validates a break above the 21-day moving average; XRP/BTC could hit the potential resistance at 2500 SAT and above.
Looking to buy or trade Ripple (XRP) now? Invest at eToro!
75% of retail investor accounts lose money when trading CFDs with this provider
Join Our Telegram channel to stay up to date on breaking news coverage