Join Our Telegram channel to stay up to date on breaking news coverage
XRP Price Prediction – November 15
XRP/USD price is trading with a bearish bias below $0.270, similar to Bitcoin. XRP price remains at a risk of more losses below the $0.250 support.
XRP/USD Market
Key Levels:
Resistance levels: $0.300, $0.310, $0.320
Support levels: $0.230, $0.220, $0.210
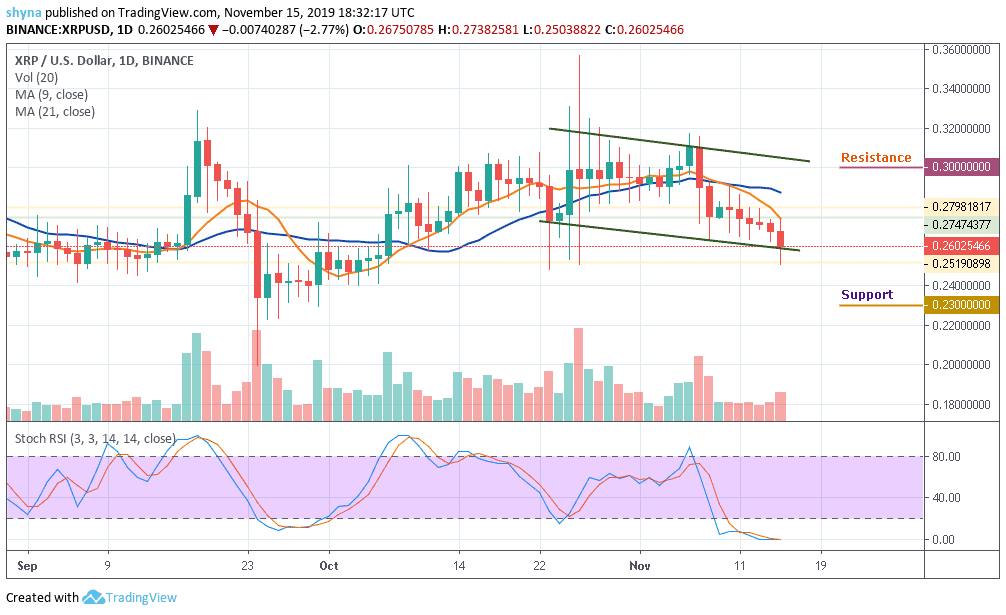
Ripple price is following a downtrend below the $0.270 support area against the USD. The price is currently trading near the $0.255 support and it could continue to decline. The recent downtrend pushed the price below the $0.270 support area and a new monthly low was formed near $0.262 and the price is currently consolidating losses. However, there are many resistances on the upside near the $0.275 and $0.280 levels.
Moreover, $0.260 remains now the key support for XRP/USD as the price moves below the 9-day and 21-day moving averages. As long as it remains intact, the coin still has a chance to resume an upward recovery. On the downside, initial support is near the $0.258 and $0.255 levels. If there is a clear break below the $0.255 support, the price may perhaps decline further below the $0.230 and $0.220 levels.
In the mentioned case, the next major support is near the $0.210 level, where the bulls might take a stand. In other words, for the upside to gain traction, the coin needs to regain ground above $0.275, while $0.300, $0.310 and $0.320 resistance levels are still the ultimate targets for the bulls. More so, the stochastic RSI is within the oversold territory, suggesting that the era of bearish movement may soon end.
When compared with Bitcoin, the Ripple market price is ranging and trading within the channel but currently moving below the 9-day and 21-day MA. For now, the coin is trading at 3071 SAT and expecting a break below the channel. Looking at the chart, any attempt by the bears to break below the channel, they may continue to push the price to the south.
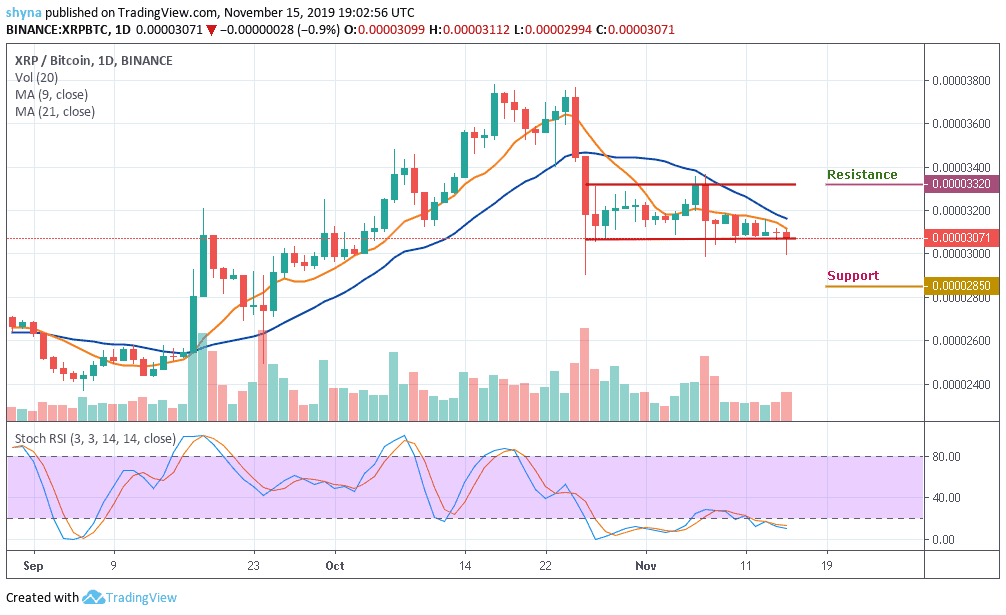
However, once the above mentioned-case is done, the next key supports could be 2850 SAT and below. Meanwhile, on the bullish side, a possible rise may likely take the price to the resistance levels of 3320 SAT and above. According to the stochastic RSI, the market is in the oversold and may cause the bears to reign for some time.
Please note: Insidebitcoins.com is not a financial advisor. Do your research before investing your funds in any financial asset or presented product or event. We are not responsible for your investing results.
Join Our Telegram channel to stay up to date on breaking news coverage