Join Our Telegram channel to stay up to date on breaking news coverage
XRP Price Prediction – October 2
Ripple (XRP) has been down by more than 3.54% in the last 24 hours; the value has gone below $0.25.
XRP/USD Market
Key Levels:
Resistance levels: $0.28, $0.30, $0.32
Support levels: $0.20, $0.18, $0.16
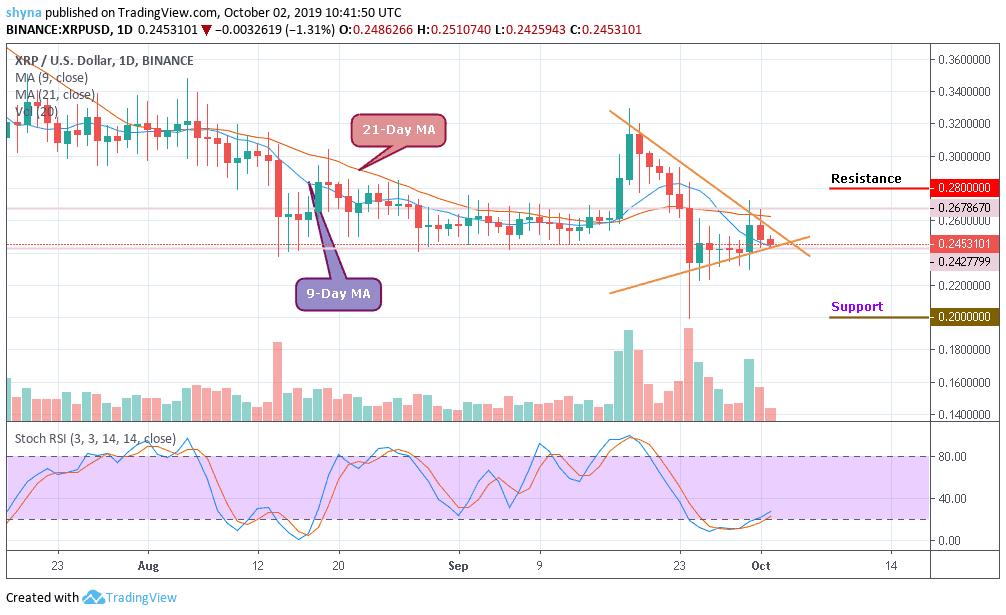
Ripple is one of the high ranked coins and its current dilapidated condition can be blamed upon the overall gloomy market. Both the 9 days and 21 days moving average are going above the current price that hints at a delay for bringing a turnaround. Meanwhile, a break in the channel may likely give the market enough strength to dig dip, but the rise might lead the market to a bullish scenario.
However, it looks like things may get worse for the coin before they get better. XRP/USD will need to make some serious gains against BTC to get back above the $0.28 resistance level. The trading volume saw a sudden surge during the latest selloff. XRP plummeted beneath the $0.26 level and continued to fall until it reaches the support around $0.24. More so, the coin went as low as $0.24 support level but managed to rebound slightly.
For now, the price is hovering around $0.024 level and the bulls are still gathering momentum. If the price move below moving averages and break down the lower part of the channel, we can expect the market to push the price to the support level of $0.20, $0.18 and $0.16 levels. Similarly, the $0.22 level could help to support the market if the nearest support level failed to contain the next bearish rally.
Meanwhile, the stochastic RSI is making an attempt to escape from the oversold condition, which indicates that the bullish trend may come to play. If the bulls can push the XRP/USD higher, further resistance is found at $0.28, $0.30 and $0.32 levels before the market is free to make another attempt at $0.34.
Comparing with Bitcoin; Looking at the daily chart, Ripple (XRP) is still demonstrating some positive signs across the market. The trend is perpetually looking bullish on the long-term and moving within the ascending channel. It is currently changing hands at 3028 SAT after witnessing a bearish day yesterday.
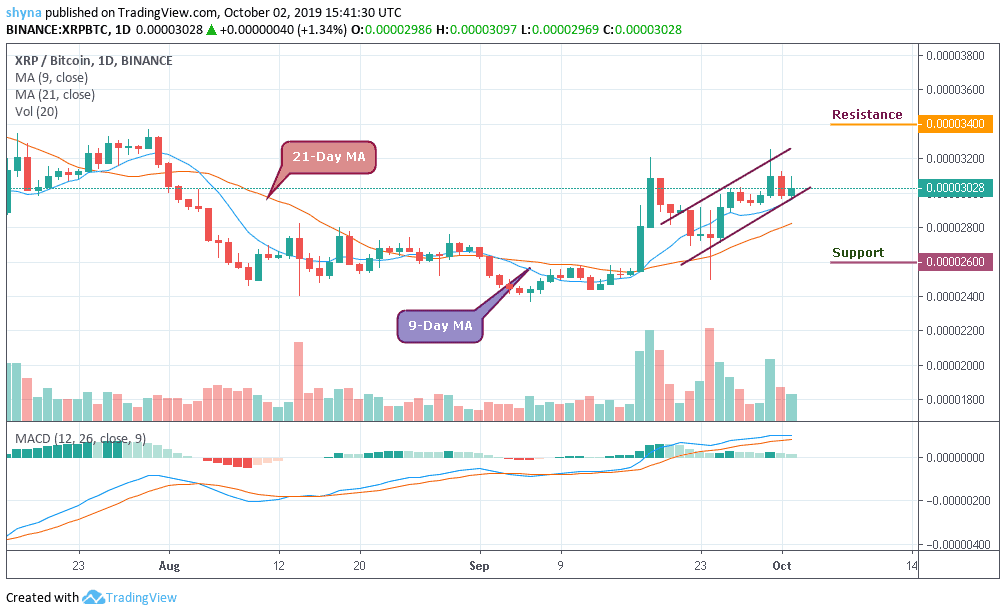
The resistance levels to look for are 3400 SAT and 3600 SAT while the closest support levels to keep watching are 2600 SAT and 2400 SAT. The MACD signal lines are on the positive side, which indicates that the bulls are stepping back into the market any moment from now.
Please note: Insidebitcoins.com is not a financial advisor. Do your research before investing your funds in any financial asset or presented product or event. We are not responsible for your investing results.
Join Our Telegram channel to stay up to date on breaking news coverage