Join Our Telegram channel to stay up to date on breaking news coverage
XRP Price Prediction – August 10
The daily chart reveals that XRP bulls are fighting to stay above the crucial $0.30 level.
XRP/USD Market
Key Levels:
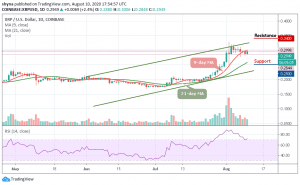
Resistance levels: $0.34, $0.36, $0.38
Support levels: $0.25, $0.23, $0.21

XRP/USD has found itself caught within a consolidation phase throughout the past few days as it trades just around $0.28 to $0.31. Since the initial pullback on August 7, XRP/USD has been struggling heavily to go back above $0.30. Just hours ago, the Ripple bulls finally managed to push the digital asset to touch $0.30 just before another crash towards $0.284.
Will XRP Break Through $0.30 Resistance Level or Reverse?
From the technical perspective, XRP is trading bullishly below the 9-day moving average in the daily chart and range is likely to sustain a short term sideways action. Meanwhile, this slightly positive picture coupled with the right trading volume could see the XRP spike above the critical hurdle at $0.30. Other areas of interest on the upside are $0.31 and $0.32. If these levels are reclaimed, XRP bulls may now have the chance to focus on higher levels at $0.34, $0.36, and $0.38 resistance levels.
On the contrary, if the technical indicator RSI (14) escape from the overbought region and moves below 70-level, the coin may likely follow the downtrend and if the $0.27 support fails to hold the selling pressure, XRPUSD may likely hit the critical supports at $0.25, $0.23, and $0.21 respectively.
Against Bitcoin, XRP is still trading on the downside, although the price action has remained intact within the 9-day and 21-day moving averages. If the selling pressure persists, the Ripple price variation may likely create a new low in the coming days.
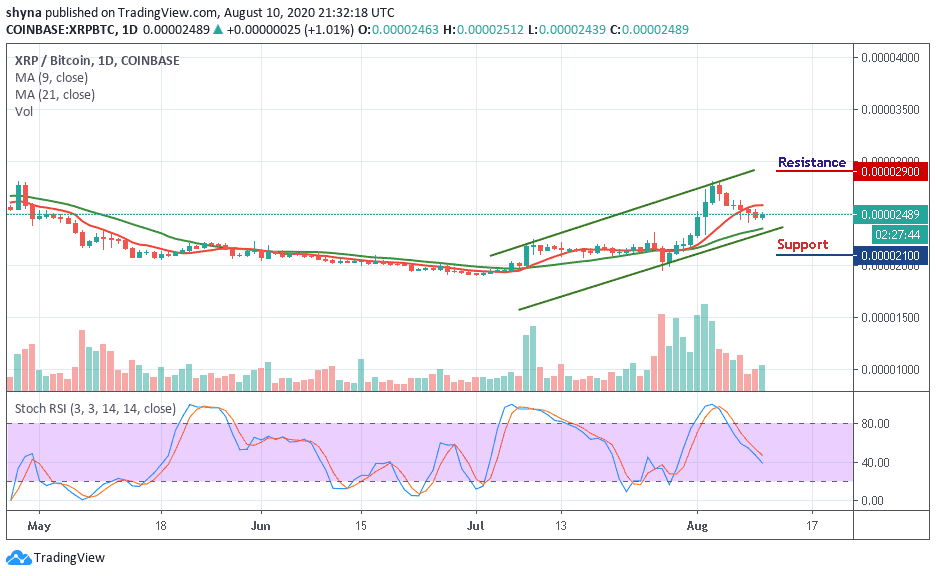
For now, the stochastic RSI is seen moving below 50-level; traders may continue to see a negative move in the market soon they can as well expect close support at the 2400 SAT before breaking below the channel to hit the critical support of 2100 SAT and below. If a bullish move occurs and validates a break significantly above the 9-day moving average; we may confirm a bull-run for the market and the closest resistance levels lie at 2900 SAT and above.
Join Our Telegram channel to stay up to date on breaking news coverage