Join Our Telegram channel to stay up to date on breaking news coverage
XRP Price Prediction – April 8
The Ripple price is trading in the positive territory, with gains of some 3.68%.
XRP/USD Market
Key Levels:
Resistance levels: $0.23, $0.24, $0.25
Support levels: $0.17, $0.16, $0.15
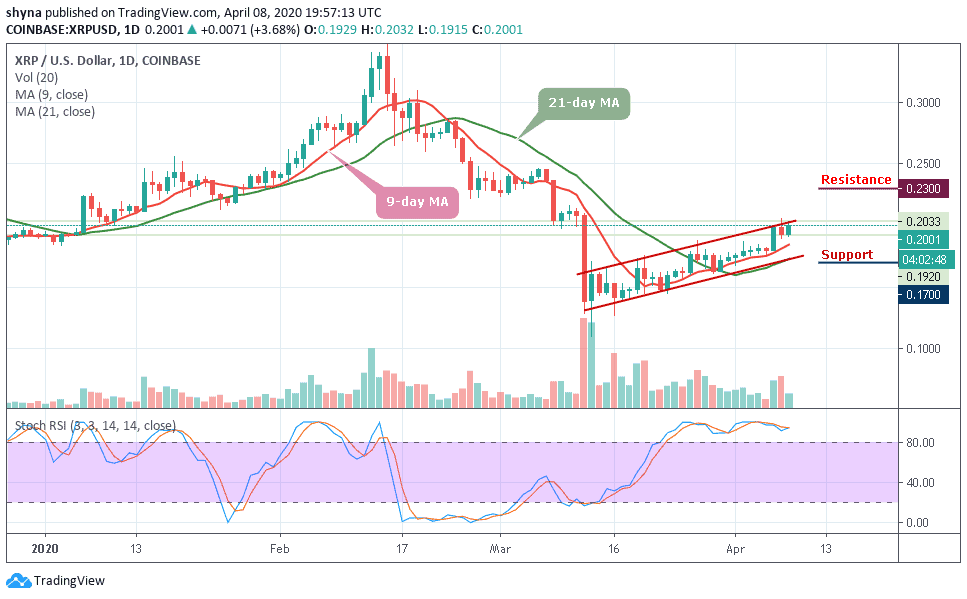
XRP/USD jumped from $0.192 in a matter of hours and touched an intraday high at $0.203. While the coin has retreated to $0.200 at the time of writing, the pair retains bullish momentum. In the short term, XRP/USD has gained more than 3.68% in the last 24 hours. The bulls needed a daily break and closure above $0.200 to invite greater buying momentum.
Currently, the price of the coin is changing hands at $00.200 level and the bulls are still pushing the price towards the north. In other words, if the price moves below the 9-day and 21-day moving averages and breaks down the lower boundary of the channel; the price could be pushed to the support levels of $0.20, $0.19 and $0.18.
Moreover, the technical indicator stochastic RSI is moving within the overbought zone which confirms the bullish trend that may take the coin to the nearest resistance level of $0.22, further resistance could be found at $0.23, $0.24 and $0.25 levels before the market is free to make another attempt at $0.26 level.
Against BTC, Ripple (XRP) is demonstrating some positive signs across the market. The trend is perpetually looking bullish in the long-term which is yet to cross the upper boundary of the descending channel. It is currently changing hands at 2738 SAT after witnessing some bearish movement last week.

The resistance levels to look for are 2900 SAT, 3000 SAT and 3100 SAT while the closest support levels to keep an eye on are 2500 SAT, 2400 SAT, and critically 2300 SAT. The technical indicator stochastic RSI is moving below the 70-level, which may likely give more bullish signals for a while.
Please note: Insidebitcoins.com is not a financial advisor. Do your research before investing your funds in any financial asset or presented product or event. We are not responsible for your investing results.
Join Our Telegram channel to stay up to date on breaking news coverage