Join Our Telegram channel to stay up to date on breaking news coverage
XRP Price Prediction – October 30
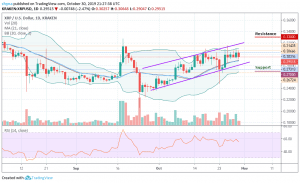
XRP/USD is floating within the channel as the price is struggling to break past the upward trend line.
XRP/USD Market
Key Levels:
Resistance levels: $0.33, $0.35, $0.37
Support levels: $0.27, $0.25, $0.23

XRP/USD has had a bullish breakout from a flag formation as it looks to consolidate its position below the $0.30 level. Earlier today, the price has gone up from $0.303 to $0.306 before giving a bearish signal as at the time of writing, the coin is also floating within the middle boundary of the Bollinger bands as the RSI (14) indicator moves around 60-level. The daily breakdown shows that the intraday support and resistance lie between $0.280 and $0.305 respectively.
Moreover, the Ripple price has continued to demonstrate a sign of weakness across its markets. Now, the XRP/USD market is down by 1.33%, reflecting a price drop in the market and the fall might become heavy if the bearish action continues. Meanwhile, the third largest-cryptocurrency has witnessed a bullish drive against USD for more than three weeks.
Therefore, since the XRP/USD is moving bullishly on short-term outlook, traders can expect the trend to keep advancing higher if the price actions still remain inside the channel. A channel breakout could strengthen bulls and push the price to the resistance levels of $33, $35 and $37 or a channel breakdown might lead the market in a bearish scenario if the price continues to fades and the closest supports to keep an eye on are $0.27, $0.25, and potentially $0.23.
Against BTC, the daily chart reveals that the coin has been making some strong progress after being able to reverse at 3124 SAT and climbed as high as 3222 SAT at the moment. More so, the trend of the pair is still looking bullish moving around the lower limit of the Bollinger bands and if the movement continues like this, it may take the price to the resistance levels of 3500 SAT and 3700 SAT.
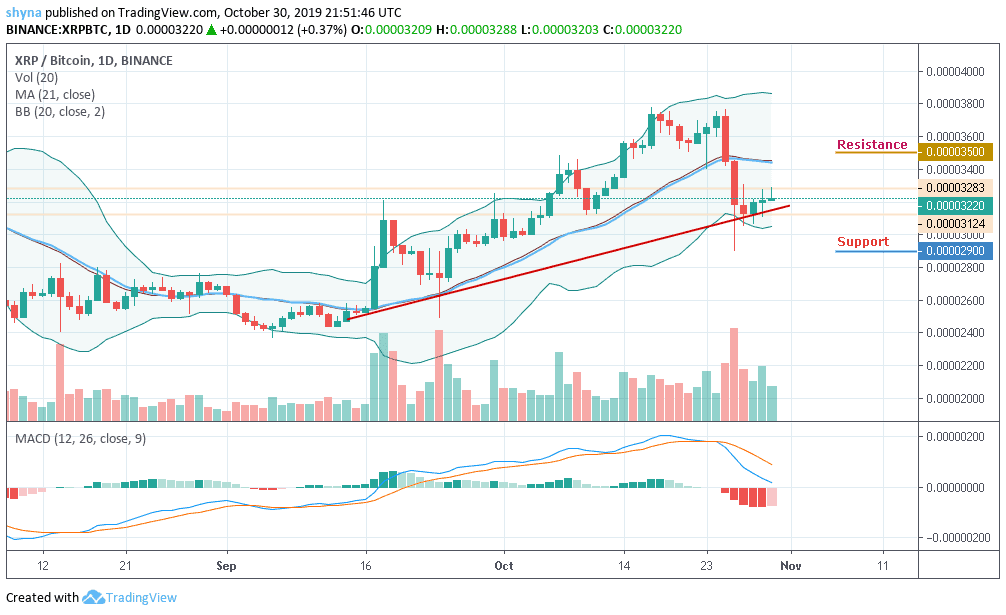
However, if the bulls failed to push the price to the north, then the bears may likely resume back into the market and breakdown the ascending channel, a drive below the channel pattern could lead to a severe bearish phase and bring the market to the support levels of 2900 SAT and below. The Moving Average Convergence/Divergence (MACD) tries to cross into the negative side.
Please note: Insidebitcoins.com is not a financial advisor. Do your research before investing your funds in any financial asset or presented product or event. We are not responsible for your investing results.
Join Our Telegram channel to stay up to date on breaking news coverage