Join Our Telegram channel to stay up to date on breaking news coverage
Ripple Price Prediction – November 19
The Ripple price prediction shows that XRP is currently pushing higher with 4.95% gains as the coin manages to face the north.
XRP/USD Market
Key Levels:
Resistance levels: $1.25, $1.30, $1.35
Support levels: $0.85, $0.80, $0.75

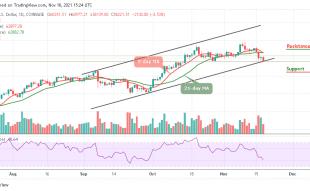
According to the daily chart above, XRP/USD manages to reach a daily high of $1.11 after the market opens today. During the European session today, the Ripple price touches the daily low of $1.00 below the 9-day and 21-day moving averages. Meanwhile, the push higher today allows XRP/USD to climb back above $1.00. This bounce towards the moving averages shows that the buyers may come to play out in the market.
Ripple Price Prediction: Ripple Price Gets Ready For More Downs
At the time of writing, the Ripple price may continue to follow the downtrend. However, if XRP/USD needs to see a shift in momentum, the bulls may need to push the price above the 9-day and 21-day moving averages, which may continue to trade upwards. The nearest resistance level could be established around the upper boundary of the channel. Therefore, a bullish breakout above the moving averages could take XRP to the potential resistance levels of $1.25, $1.30, and $1.35 as the technical indicator Relative Strength Index (14) makes a quick turn above 40-level.
At the time of writing, XRP/USD is trading at $1.09 after holding above $1.00. On the contrary, a bearish movement towards the lower boundary of the channel may cause the Ripple price to spiral downward and hit the support levels of $0.85, $0.80, and $0.75 respectively.
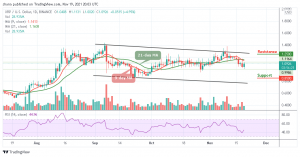
Against Bitcoin, Ripple (XRP) is still demonstrating some positive signs across the market. The trend is likely to follow the bullish movement in the long-term and moving within the channel take the coin to the higher levels. XRP/BTC is currently changing hands at 1884 SAT above the 9-day and 21-day moving averages.
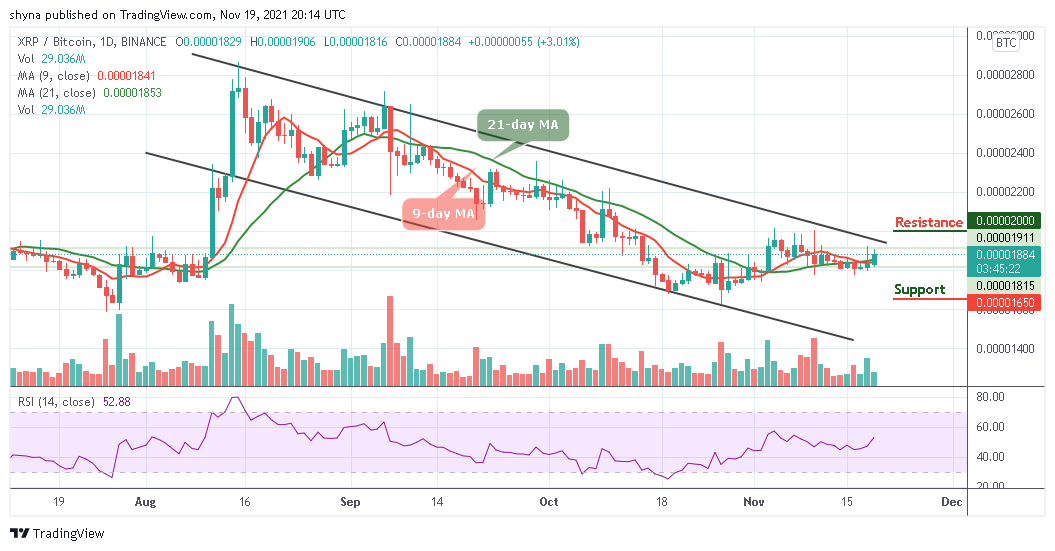
However, the resistance level is located around 2000 SAT and above but any bearish movement may bring the coin to the closest support level at 1650 SAT and below. Meanwhile, the technical indicator Relative Strength Index (14) is moving above 50-level, suggesting a bullish movement for the market.
Looking to buy or trade Ripple (XRP) now? Invest at eToro!
68% of retail investor accounts lose money when trading CFDs with this provider
Join Our Telegram channel to stay up to date on breaking news coverage