Join Our Telegram channel to stay up to date on breaking news coverage
XRP Price Prediction – March 19
The Ripple (XRP) is moving above the barrier that is limiting the recovery as RSI bodes well for XRP short-term bulls.
XRP/USD Market
Key Levels:
Resistance levels: $0.200, $0.220, $0.240
Support levels: $0.100, $0.008, $0.006
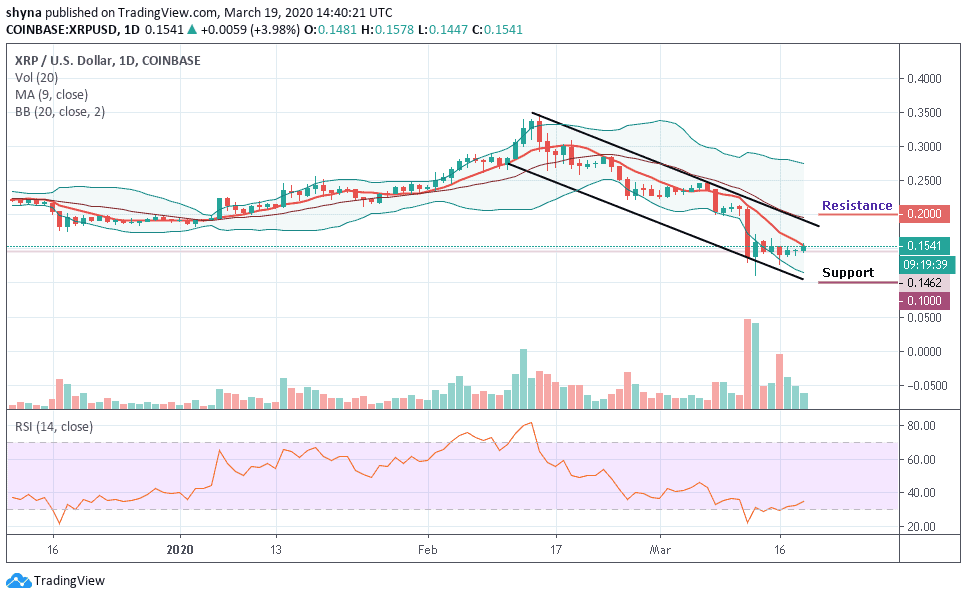
XRP/USD has been gaining ground rapidly amid the recovery on the cryptocurrency market with the 9-day moving average now coming into view. The third-largest digital asset with the current market value of $6.76 billion has increased by 3.98% on a day-to-day basis and hit the intraday high at $0.159. At the time of writing, XRP/USD is changing hands at $0.154.
Furthermore, XRP/USD broke free from the recent range amid the global recovery on the cryptocurrency market. A sustainable move above the barrier of $0.150 improved the short-term technical picture; however, traders will need to see an increase above the 9-day moving average at $0.160 for the upside to gain traction. Once this happens, psychological $0.165 followed by $0.180 which the highest level of the current consolidation range may come into view.
Nonetheless, if the price moves back below $0.150, XRP/USD will enter a range-bound phase with a bearish bias. The next support may come at $0.135. A sustainable move below this level will attract more short-term sellers to the market and bring $0.120 into focus; any further movement may bring it to $0.100, $0.008 and $0.006 support levels. However, the upward-looking RSI (14) on the daily chart implies that the price may continue growing in the short run and the resistance levels to watch for are $0.200, $0.220 and $0.224.
Comparing with Bitcoin, the Ripple price is changing hands at 2650 SAT and it is currently trading below the 9-day moving average. XRP/BTC is about to break below the lower boundary of the channel because the technical indicator suggests that the price may break down as RSI (14) nosedives to the south. The nearest support to be visited lies at 2500 SAT and below.
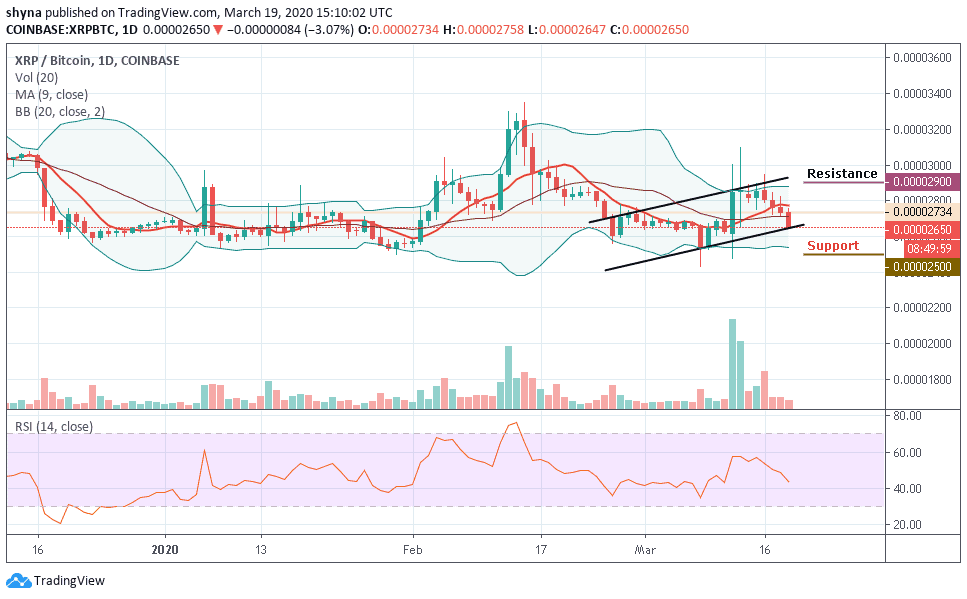
In addition, the fact that a bearish pattern has been created within a large support area increases the possibility that it will soon initiate a reversal. Meanwhile, if the bulls could push the price above the 9-day moving average, the coin could likely reach the closest resistance levels at 2900 SAT and above.
Please note: Insidebitcoins.com is not a financial advisor. Do your research before investing your funds in any financial asset or presented product or event. We are not responsible for your investing results.
Join Our Telegram channel to stay up to date on breaking news coverage